This chapter contains the following sections:
This section provides an introduction to the SonicWALL SonicOS Enhanced packet capture feature. This section contains the following subsections:
Packet capture is a mechanism that allows you to capture and examine the contents of individual data packets that traverse your SonicWALL firewall appliance. The captured packets contain both data and addressing information. The captured addressing information from the packet header includes the following:
You can configure the packet capture feature in the SonicOS Enhanced user interface (UI). The UI provides a way to configure the capture criteria, display settings, and file export settings, and displays the captured packets.
The SonicOS Enhanced packet capture feature provides the functionality and flexibility that you need to examine network traffic without the use of external utilities, such as Wireshark (formerly known as Ethereal). SonicOS Enhanced 4.0 and higher include the following improvements in the packet capture tool:
|
•
|
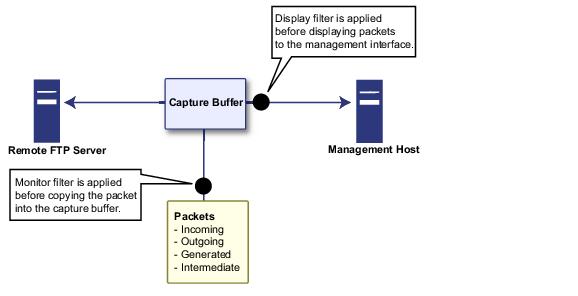
As an administrator, you can configure the general settings, capture filter, display filter, advanced settings, and FTP settings of the packet capture tool. As network packets enter the packet capture subsystem, the capture filter settings are applied and the resulting packets are written to the capture buffer. The display filter settings are applied as you view the buffer contents in the UI. You can log the capture buffer to view in the UI, or you can configure automatic transfer to the FTP server when the buffer is full.
Default settings are provided so that you can start using packet capture without configuring it first. The basic functionality is as follows:
|
Start : |
Click Start to begin capturing all packets except those used for communication between the SonicWALL appliance and the UI on your console system. |
||||||||
|
Stop : |
Click Stop to stop the packet capture. |
||||||||
|
Clear : |
Click Clear to clear the status counters that are displayed at the top of the Packet Capture page. |
||||||||
|
Refresh : |
Click Refresh to display new buffer data in the Captured Packets window. You can then click any packet in the window to display its header information and data in the Packet Detail and Hex Dump windows. |
||||||||
|
Display or save a snapshot of the current buffer in the file format that you select from the drop-down list. Saved files are placed on your local management system (where the UI is running). Choose from the following formats:
|
Refer to the figure below to see a high level view of the packet capture subsystem. This shows the different filters and how they are applied.
This section contains the following subsections:
This section describes how to access the packet capture tool in the SonicOS UI. There are two ways to access the Packet Capture screen.
|
Step 2
|
To go directly to the Packet Capture screen, in the left pane, under
System
, click Packet
Capture
.
|
The Packet Capture screen has buttons for starting and stopping a packet capture. You can start a packet capture that uses default settings without configuring specific criteria for packet capture, display, FTP export, and other settings. If you start a default packet capture, the SonicWALL appliance will capture all packets except those for internal communication, and will stop when the buffer is full or when you click Stop.
|
Step 1
|
Navigate to the
Packet Capture
page in the UI. See “Accessing Packet Capture in the User Interface”
.
|
|
Step 2
|
Under
Packet Capture
, optionally click Clear
to set the statistics back to zero.
|
|
Step 3
|
Under
Packet Capture
, click Start
.
|
|
Step 4
|
You can view the captured packets in the Captured Packets, Packet Detail, and Hex Dump sections of the screen. See “Viewing the Captured Packets” .
|
Step 1
|
Navigate to the
Packet Capture
page in the UI. See “Accessing Packet Capture in the User Interface”
.
|
|
Step 2
|
Under
Packet Capture
, click Stop
.
|
The UI provides three windows to display different views of the captured packets. The following sections describe the viewing windows:
The Captured Packets window displays the following statistics about each packet:
|
•
|
Ingress - The SonicWALL appliance interface on which the packet arrived is marked with
an asterisk (*). The subsystem type abbreviation is shown in parentheses. Subsystem type abbreviations are defined in the following table.
|
|
–
|
The subsystem type abbreviation is shown in parentheses. See the table above for
definitions of subsystem type abbreviations
|
The status field shows the state of the packet with respect to the firewall. A packet can be dropped, generated, consumed or forwarded by the SonicWALL appliance. You can position the mouse pointer over dropped or consumed packets to show the following information.
|
•
|
Length [Actual] - Length value is the number of bytes captured in the buffer for this packet.
Actual value, in brackets, is the number of bytes transmitted in the packet.
|
You can configure the number of bytes to capture. See “Configuring General Settings” .
When you click on a packet in the Captured Packets window, the packet header fields are displayed in the Packet Detail window. The display will vary depending on the type of packet that you select.
When you click on a packet in the Captured Packets window, the packet data is displayed in hexadecimal and ASCII format in the Hex Dump window. The hex format is shown on the left side of the window, with the corresponding ASCII characters displayed to the right for each line. When the hex value is zero, the ASCII value is displayed as a dot.
You can access the packet capture tool on the System > Packet Capture page of the SonicOS UI. There are five main areas of configuration for the packet capture tool. The following sections describe the configuration options, and provide procedures for accessing and configuring packet capture:
This section describes how to configure packet capture general settings, including the number of bytes to capture per packet and the buffer wrap option. You can specify the number of bytes using either decimal or hexadecimal, with a minimum value of 14. The buffer wrap option enables the packet capture to continue even when the buffer becomes full, by overwriting the buffer from the beginning.
|
Step 1
|
Navigate to the
Packet Capture
page in the UI. See “Accessing Packet Capture in the User Interface”
.
|
|
Step 2
|
Under
Packet Capture
, click Configure
.
|
|
Step 3
|
In the
Packet Capture Configuration
window, click the General
tab.
|
|
Step 4
|
In the
Number of Bytes To Capture (per packet)
box, type a number. The minimum value is 14.
|
|
Step 5
|
To continue capturing packets after the buffer fills up, select the
Wrap Capture Buffer Once
Full
checkbox. Selecting this option will cause packet capture to start writing captured packets at the beginning of the buffer again after the buffer fills.
|
|
Step 6
|
Click
OK
.
|
To configure Packet Capture complete the following steps:
|
Step 1
|
Navigate to the
Packet Capture
page in the UI. See “Accessing Packet Capture in the User Interface”
.
|
|
Step 2
|
Under
Packet Capture
, click Configure
.
|
|
Step 3
|
In the
Packet Capture Configuration
window, click the Capture Filter
tab.
|
|
•
|
Interface Name(s)
- You can specify up to ten interfaces separated by commas. Refer to the Network > Interfaces screen in the UI for the available interface names. You can use a negative value to configure all interfaces except the one(s) specified; for example: !X0, or !LAN.
|
|
•
|
Ether type
- You can specify up to ten Ethernet types separated by commas. Currently, the following Ethernet types are supported: ARP, IP, PPPoE-SES, and PPPoE-DIS. The latter two can be specified by PPPoE alone. This option is not case-sensitive. For example, to capture all supported types, you could enter: ARP, IP, PPPOE. You can use one or more negative values to capture all Ethernet types except those specified; for example: !ARP, !PPPoE. You can also use hexadecimal values to represent the Ethernet types, or mix hex values with the standard representations; for example: ARP, 0x800, IP. Normally you would only use hex values for Ethernet types that are not supported by acronym in SonicOS Enhanced. See “Supported Packet Types”
.
|
|
•
|
IP type(s)
- You can specify up to ten IP types separated by commas. The following IP types are supported: TCP, UDP, ICMP, GRE, IGMP, AH, ESP. This option is not case-sensitive. You can use one or more negative values to capture all IP types except those specified; for example: !TCP, !UDP. You can also use hexadecimal values to represent the IP types, or mix hex values with the standard representations; for example: TCP, 0x1, 0x6. See “Supported Packet Types”
.
|
|
•
|
Source IP address(es)
- You can specify up to ten IP addresses separated by commas; for example: 10.1.1.1, 192.2.2.2. You can use one or more negative values to capture packets from all but the specified addresses; for example: !10.3.3.3, !10.4.4.4.
|
|
•
|
Source port(s)
- You can specify up to ten port numbers separated by commas; for example: 20, 21, 22, 25. You can use one or more negative values to capture packets from all but the specified ports; for example: !80, !8080.
|
|
•
|
Destination IP address(es)
- You can specify up to ten IP addresses separated by commas; for example: 10.1.1.1, 192.2.2.2. You can use one or more negative values to capture packets destined for all but the specified addresses; for example: !10.3.3.3, !10.4.4.4.
|
|
•
|
Destination port(s)
- You can specify up to ten port numbers separated by commas; for example: 20, 21, 22, 25. You can use one or more negative values to capture packets destined for all but the specified ports; for example: !80, !8080.
|
|
•
|
Bidirectional address and port mapping
- When this option is selected, IP addresses and ports specified here will be matched against both the source and destination fields in each packet.
|
|
Note
|
If a field is left blank, no filtering is done on that field. Packets are captured without regard
to the value contained in that field of their headers.
|
This section describes how to configure packet capture display filter settings. The values that you provide here are compared to corresponding fields in the captured packets, and only those packets that match are displayed.
|
Note
|
If a field is left blank, no filtering is done on that field. Packets are displayed without regard
to the value contained in that field of their headers.
|
To configure Packet Capture display filter settings, complete the following steps:
|
Step 1
|
Navigate to the
Packet Capture
page in the UI. See “Accessing Packet Capture in the User Interface”
.
|
|
Step 2
|
Under
Packet Capture
, click Configure
.
|
|
Step 3
|
In the
Packet Capture Configuration
window, click the Display Filter
tab.
|
|
Step 4
|
In the
Interface Name(s)
box, type the SonicWALL appliance interfaces for which to display packets, or use the negative format (!X0) to display packets captured from all interfaces except those specified. You can specify up to ten interfaces separated by commas. Refer to the Network > Interfaces
screen in the UI for the available interface names.
|
|
Step 5
|
In the
Ether Type(s)
box, enter the Ethernet types for which you want to display packets, or use the negative format (!ARP) to display packets of all Ethernet types except those specified. You can specify up to ten Ethernet types separated by commas. Currently, the following Ethernet types are supported: ARP, IP, PPPoE-SES, and PPPoE-DIS. The latter two can be specified by PPPoE alone. You can also use hexadecimal values to represent the Ethernet types, or mix hex values with the standard representations; for example: ARP, 0x800, IP. Normally you would only use hex values for Ethernet types that are not supported by acronym in SonicOS Enhanced. See “Supported Packet Types”
.
|
|
Step 6
|
In the
IP Type(s)
box, enter the IP packet types for which you want to display packets, or use the negative format (!UDP) to display packets of all IP types except those specified. You can specify up to ten IP types separated by commas. The following IP types are supported: TCP, UDP, ICMP, GRE, IGMP, AH, ESP. You can also use hexadecimal values to represent the IP types, or mix hex values with the standard representations; for example: TCP, 0x1, 0x6. See “Supported Packet Types”
. To display all IP types, leave blank.
|
|
Step 7
|
In the
Source IP Address(es)
box, type the IP addresses from which you want to display packets, or use the negative format (!10.1.2.3) to display packets captured from all source addresses except those specified.
|
|
Step 8
|
In the
Source Port(s)
box, type the port numbers from which you want to display packets, or use the negative format (!25) to display packets captured from all source ports except those specified.
|
|
Step 9
|
In the
Destination IP Address(es)
box, type the IP addresses for which you want to display packets, or use the negative format (!10.1.2.3) to display packets with all destination addresses except those specified.
|
|
Step 10
|
In the
Destination Port(s)
box, type the port numbers for which you want to display packets, or use the negative format (!80) to display packets with all destination ports except those specified.
|
|
Step 11
|
To match the values in the source and destination fields against either the source or destination
information in each captured packet, select the Enable Bidirectional Address and Port
Matching
checkbox.
|
|
Step 12
|
To display captured packets that the SonicWALL appliance forwarded, select the
Forwarded
checkbox.
|
|
Step 13
|
To display captured packets that the SonicWALL appliance generated, select the
Generated
checkbox.
|
|
Step 14
|
|
Step 15
|
This section describes how to configure packet capture logging settings. These settings provide a way to configure automatic logging of the capture buffer to an external FTP server. When the buffer fills up, the packets are transferred to the FTP server. The capture continues without interruption.
If you configure automatic logging, this supersedes the setting for wrapping the buffer when full. With automatic FTP logging, the capture buffer is effectively wrapped when full, but you also retain all the data rather than overwriting it each time the buffer wraps.
|
Step 1
|
Navigate to the
Packet Capture
page in the UI. See “Accessing Packet Capture in the User Interface”
.
|
|
Step 2
|
Under
Packet Capture
, click Configure
.
|
|
Step 3
|
In the
Packet Capture Configuration
window, click the Logging
tab.
|
|
Step 4
|
In the
FTP Server IP Address
box, type the IP address of the FTP server. For example, type 10.1.2.3.
|
|
Note
|
Make sure that the FTP server IP address is reachable by the SonicWALL appliance. An IP
address that is reachable only via a VPN tunnel is not supported.
|
|
Step 5
|
In the
Login ID
box, type the login name that the SonicWALL appliance should use to connect to the FTP server.
|
|
Step 6
|
In the
Password
box, type the password that the SonicWALL appliance should use to connect to the FTP server.
|
|
Step 7
|
In the
Directory Path
box, type the directory location for the transferred files. The files are written to this location relative to the default FTP root directory. For libcap format, files are named “packet-log--<>.cap”, where the <> contains a run number and date including hour, month, day, and year. For example, packet-log--3-22-08292006.cap. For HTML format, file names are in the form: “packet-log_h-<>.html”. An example of an HTML file name is: packet-log_h-3-22-08292006.html.
|
|
Step 8
|
To enable automatic transfer of the capture file to the FTP server when the buffer is full, select
the Log To FTP Server Automatically
checkbox. Files are transferred in both libcap and HTML format.
|
|
Step 9
|
To enable transfer of the file in HTML format as well as libcap format, select the
Log HTML File
Along With .cap File (FTP)
.
|
|
Step 10
|
To test the connection to the FTP server and transfer the capture buffer contents to it, click
Log
Now
. In this case the file name will contain an ‘F’. For example, packet-log-F-3-22-08292006.cap or packet-log_h-F-3-22-08292006.html.
|
|
Step 11
|
This section describes how to configure settings for the following:
|
Step 1
|
Navigate to the
Packet Capture
page in the UI. See “Accessing Packet Capture in the User Interface”
.
|
|
Step 2
|
Under
Packet Capture
, click Configure
.
|
|
Step 3
|
In the
Packet Capture Configuration
window, click the Advanced
tab.
|
|
Step 4
|
To capture packets generated by the SonicWALL appliance, select the
Capture Firewall
Generated Packets
checkbox.
|
Even when interfaces specified in the capture filters do not match, this option ensures that packets generated by the SonicWALL appliance are captured. This includes packets generated by HTTP(S), L2TP, DHCP servers, PPP, PPPOE, and routing protocols. Captured packets are marked with ‘s’ in the incoming interface area when they are from the system stack. Otherwise, the incoming interface is not specified.
|
Step 5
|
To capture intermediate packets generated by the SonicWALL appliance, select the
Capture
Intermediate Packets
checkbox.
|
Intermediate packets include packets generated as a result of fragmentation or reassembly, intermediate encrypted packets, IP helper generated packets, and replicated multicast packets.
|
Step 6
|
To exclude encrypted management or syslog traffic to or from GMS, select the
Exclude
encrypted GMS traffic
checkbox.
|
This setting only affects encrypted traffic within a configured primary or secondary GMS tunnel. GMS management traffic is not excluded if it is sent via a separate tunnel.
|
Step 7
|
To exclude management traffic, select the
Exclude Management Traffic
checkbox and select one or more checkboxes for HTTP/HTTPS
, SNMP
, or SSH
. If management traffic is sent via a tunnel, the packets are not excluded.
|
|
Step 8
|
To exclude syslog traffic to a server, select the
Exclude Syslog Traffic to
checkbox and select one or more checkboxes for Syslog Servers
or GMS Server
. If syslog traffic is sent via a tunnel, the packets are not excluded.
|
|
Step 9
|
To exclude internal traffic between the SonicWALL appliance and its High Availability partner
or a connected SonicPoint, select the Exclude Internal Traffic for
checkbox and select one or both checkboxes for HA
or SonicPoint
.
|
If automatic FTP logging is off, either because of a failed connection or simply disabled, you can restart it in Configure > Logging .
|
Step 1
|
Navigate to the
Packet Capture
page in the UI. See “Accessing Packet Capture in the User Interface” on page 96
.
|
|
Step 2
|
Under
Packet Capture
, click Configure
.
|
|
Step 3
|
In the
Packet Capture Configuration
window, click the Logging
tab.
|
|
Step 4
|
|
Step 5
|
To change the FTP logging status on the main packet capture page to “active”, select the
Log
To FTP Server Automatically
checkbox.
|
|
Step 6
|
Click
OK
.
|
This section describes how to tell if your packet capture is working correctly according to the configuration. It contains the following sections:
The main Packet Capture screen displays status indicators for packet capture and FTP logging. The packet capture status indicator shows one of the following three conditions:
The UI also displays the buffer size, the number of packets captured, the percentage of buffer space used, and how much of the buffer has been lost. Lost packets occur when automatic FTP logging is turned on, but the file transfer is slow for some reason. If the transfer is not finished by the time the buffer is full again, the data in the newly filled buffer is lost.
|
Note
|
The FTP logging status indicator shows one of the following three conditions:
To restart automatic FTP logging, see “Restarting FTP Logging” .
Next to the FTP logging indicator, the UI also displays the number of successful and failed attempts to transfer the buffer contents to the FTP server, the current state of the FTP process thread, and the status of the capture buffer.
Under the FTP logging indicator, on the Current Buffer Statistics line, the UI displays the number of packets dropped, forwarded, consumed, generated, or unknown.
On the Current Configurations line, you can hover your mouse pointer over Filters, General, or Logging to view the currently configured value for each setting in that category. The Filters display includes the capture filter and display filter settings. The display for General includes both the general and advanced settings. The Logging display shows the FTP logging settings.
You can clear the packet capture queue and the displayed statistics for the capture buffer and FTP logging.
|
Step 1
|
Navigate to the
Packet Capture
page in the UI.
|
|
Step 2
|
Under
Packet Capture
, click Clear
.
|
This section contains the following:
When specifying the Ethernet or IP packet types that you want to capture or display, you can use either the standard acronym for the type, if supported, or the corresponding hexadecimal representation. To determine the hex value for a protocol, refer to the RFC for the number assigned to it by IANA. The protocol acronyms that SonicOS Enhanced currently supports are as follows:
|
|||
|
|||
|
To specify both PPPoE-DIS and PPPoE-SES, you can simply use PPPoE. |
|||
|
|||
|
|||
|
|||
|
|||
|
|||
|
|||
|
This section contains the following examples of the file formats available in the Export As option:
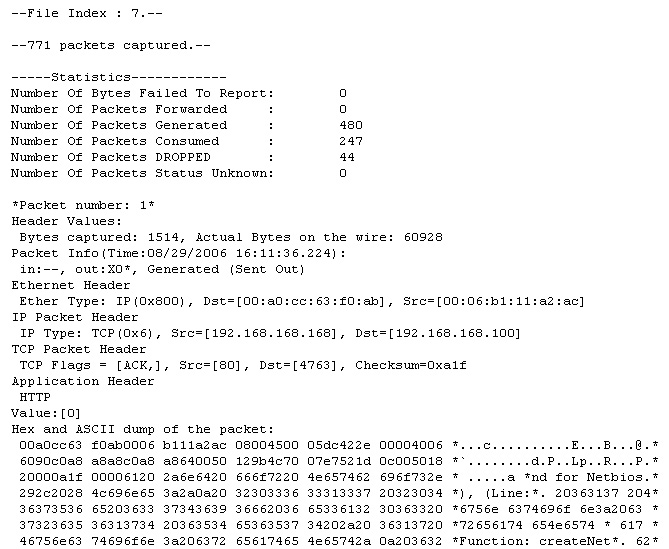
You can view the HTML format in a browser. The following is an example showing the header and part of the data for the first packet in the buffer.

You can view the text format output in a text editor. The following is an example showing the header and part of the data for the first packet in the buffer.