The real-time application monitoring features rely on the flow collection mechanism to collect and display data. Before you can view the applications chart in the Dashboard > Real-Time Monitor, Dashboard > AppFlow Monitor, or Dashboard > AppFlow Reports pages, you must first enable and configure the flow collection feature.
|
1
|
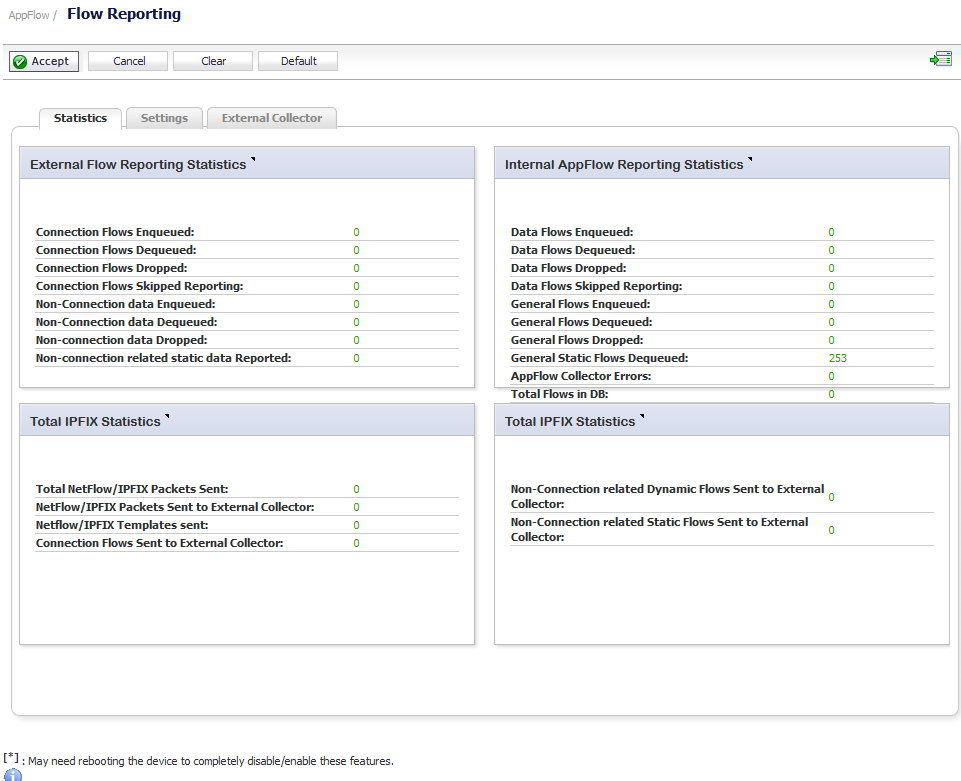
Navigate to the AppFlow > Flow Reporting page.
|
|
2
|
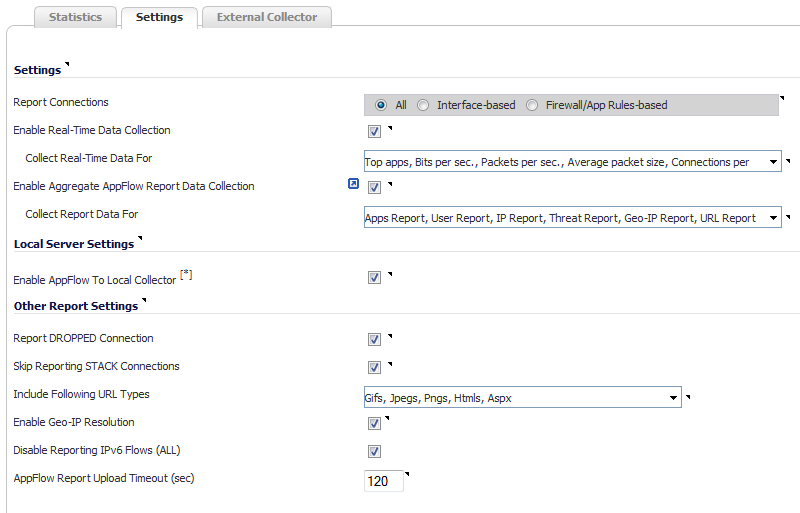
Click the Settings tab.
|
|
3
|
In the Settings section, select the Enable Real-Time Data Collection check box to enable data collation for real-time statistics. This option is enabled by default.
|
|
4
|
From the Collect Real-Time Data For drop-down menu, select the reports you want. By default, all are selected.
|
|
•
|
|
5
|
In the Local Server Settings section, select the Enable AppFlow To Local Collector checkbox. This option is enabled by default.
|
|
6
|
To enable these reports, click the Accept button to save your changes.
|
|
7
|
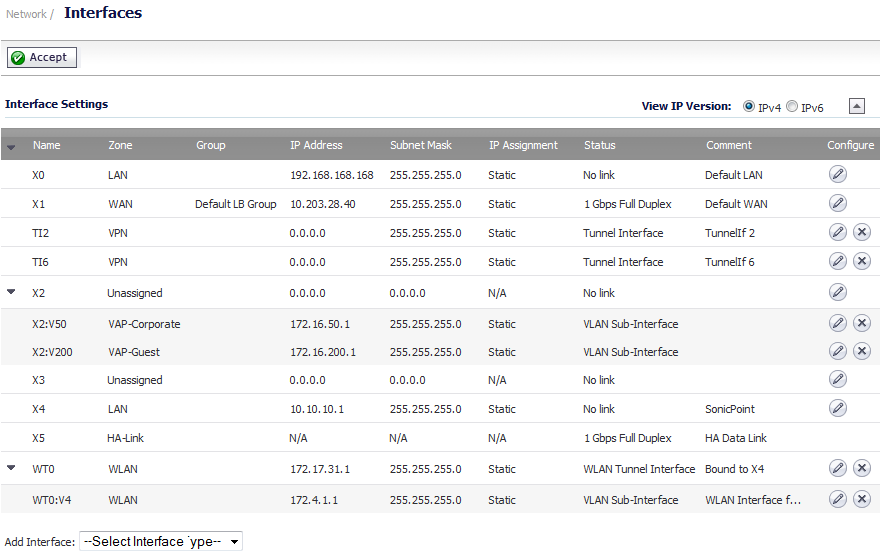
Navigate to the Network > Interfaces page.
|
|
8
|
In the Configure column, click the Edit icon for the interface on which you wish to enable flow reporting. The Edit Interface dialog displays.
|
|
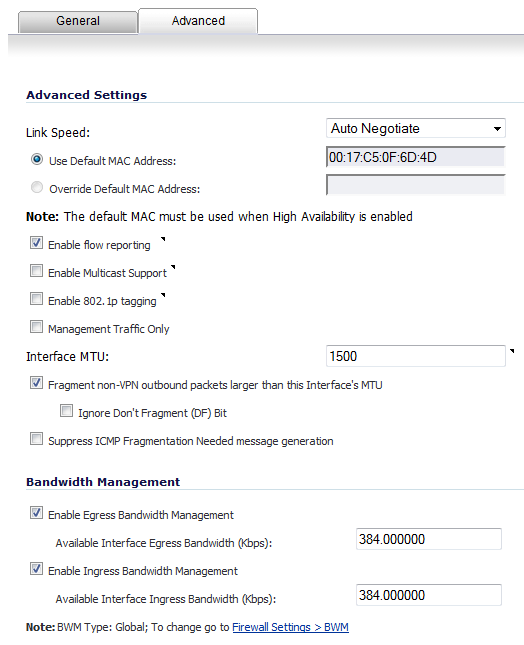
9
|
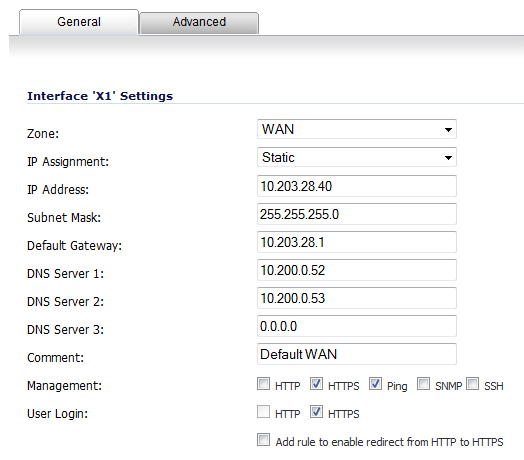
Click the Advanced tab.
|
|
10
|
Ensure that the Enable flow reporting checkbox is selected. This option is selected by default.
|
|
11
|
Click the OK button to save your changes.
|
For more detained information on configuring Flow Reporting, see AppFlow Overview and AppFlow > Flow Reporting.