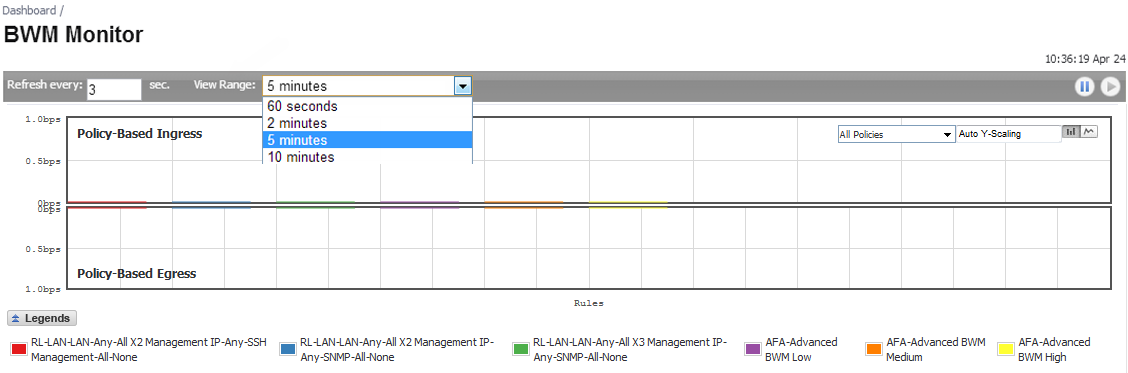
The Policy-based Ingress/Egress graph can display a real-time bandwidth image or a history image. The interval range can be changed by selecting a value for the View Range list.
Pausing the mouse over certain items displays tooltip information.
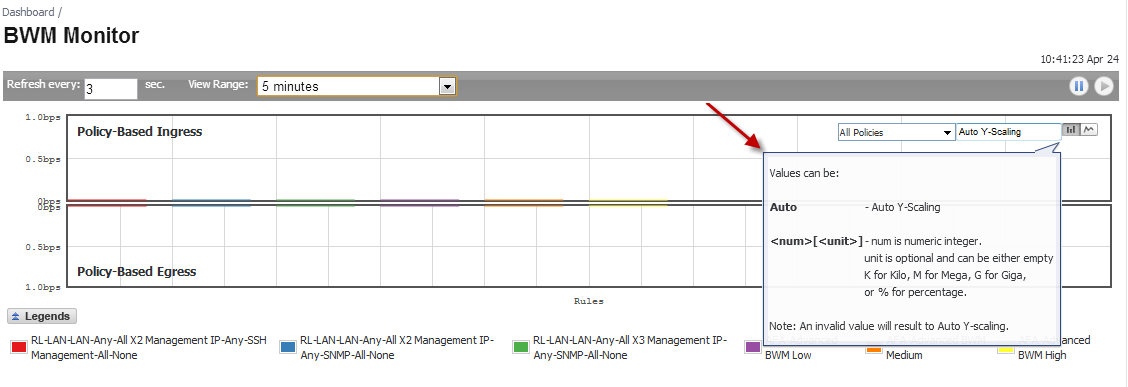
The Auto Y-Scaling, Bar Graph, and Flow Chart options are described in Common Features.