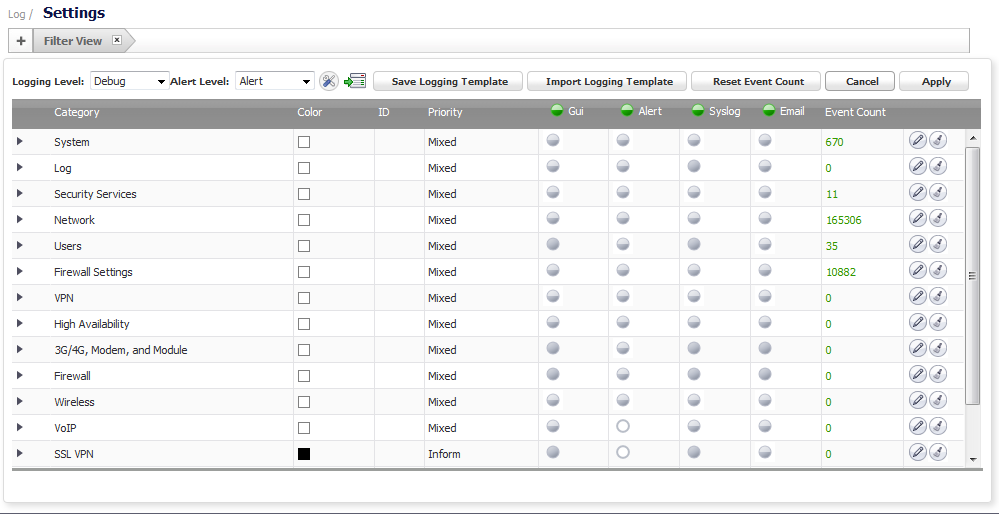
The Log > Settings page displays logging data in a series of columns and allows you to configure the logging entries and to reset event counts. You can filter the entries to limit the data display to only those events of interest. You can import and save logging templates.
The Category column of the Log Monitor table has three levels:
|
•
|
Category, first and highest level of the tree structure
|
|
•
|
Group, the second level
|
|
•
|
Event, the third level
|
The Color column shows the color with which the event, group, or category is highlighted in Dashboard > Log Monitor.
The ID column shows the ID number of the event. The ID for a particular message is listed in the SonicOS Combined Log Events Reference Guide.
The Priority column shows the severity or priority of a category, group, or event. For events, a drop-down menu lists the selectable priorities. For categories and groups, the priorities are listed in the dialog when you click the Configure button at the end of the row.
|
•
|
|
•
|
|
•
|
|
•
|
|
•
|
|
•
|
|
•
|
The GUI column indicates whether this item is displayed in Dashboard > Log Monitor. Display of categories and groups is shown with a To show or hide:
|
•
|
The Alert column shows checkboxes that indicate whether an Alert message will be sent for this event, group, or category.
The Syslog column shows checkboxes that indicate whether the event, group, or category will be sent to a Syslog server.
The Email column shows checkboxes that indicate whether the log will be emailed to the configured address. For events, these checkboxes are configurable in the column. For categories and groups, Email is configured in the Edit Log Group or Edit Log Category dialogs that appear when you click the Configure button at the end of the row.
The Event Count column shows the count of events by:
|
•
|
Event level — the value shows the number of times that this event has occurred.
|
|
•
|
Group level — the value shows the total events that occurred within the group.
|
|
•
|
Category level — the value shows the total events that occurred within the category.
|
|
•
|
|
•
|
The Configure and Reset Event Count icons appear at the end of each row.
The Configure icon launches the Edit Log Event, Edit Log Group, or Edit Log Category dialog. You can configure all of the attributes for an event, group, or category.
The Reset Event Count icon ![]() resets the event counter for an event, a group, or a category, and the event counters of higher levels are recalculated. To reset all counters, use the Reset Event Count button above the Log Settings table, as described in Reset Event Count Button .
resets the event counter for an event, a group, or a category, and the event counters of higher levels are recalculated. To reset all counters, use the Reset Event Count button above the Log Settings table, as described in Reset Event Count Button .