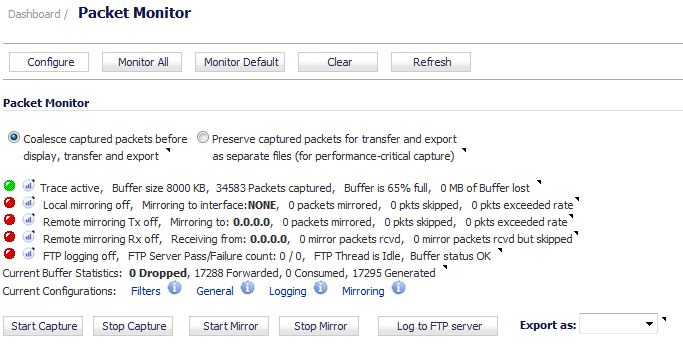
The other buttons and displays on this page are described in the following sections:
|
1
|
Navigate to the Dashboard > Packet Monitor page.
|
|
2
|
Optionally click Clear to set the statistics back to zero.
|
|
3
|
|
5
|
To stop the packet capture, click Stop Capture.
|
You can view the captured packets in the Captured Packets, Packet Detail, and Hex Dump sections of the Packet Monitor page. See Viewing Captured Packets .
You can start packet mirroring that uses your configured mirror settings by clicking Start Mirror. It is not necessary to first configure specific criteria for display, logging, FTP export, and other settings. Packet mirroring stops when you click Stop Mirror.
|
1
|
Navigate to the Dashboard > Packet Monitor page.
|
|
2
|
Under Packet Monitor, click Start Mirror to start mirroring packets according to your configured settings.
|
|
3
|
To stop mirroring packets, click Stop Mirror.
|
To begin logging to an FTP server at any time, click Log to FTP server.
|
NOTE: If you have not entered a valid server IP address on the Configure > Logging dialog, this message displays:
|
The Dashboard > Packet Monitor page provides three sections to display different views of captured packets:
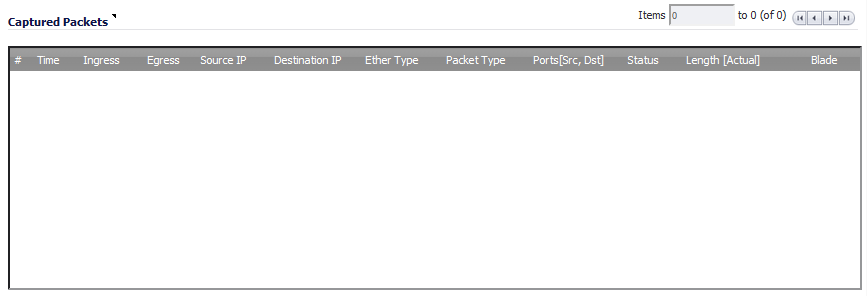
The Captured Packets section displays the following statistics about each packet:
|
•
|
# - The packet number relative to the start of the capture
|
|
•
|
Time - The date and time that the packet was captured
|
|
•
|
|
•
|
|
•
|
Source IP - The source IP address of the packet.
|
|
•
|
Destination IP - The destination IP address of the packet.
|
|
•
|
Ether Type - The Ethernet type of the packet from its Ethernet header.
|
|
•
|
Packet Type - The type of the packet depending on the Ethernet type, as shown in Table 18.
|
|
•
|
Ports [Src, Dst] - The source and destination TCP or UDP ports of the packet
|
|
•
|
Status - The status field for the packet
|
The status field shows the state of the packet with respect to the firewall. A packet can be dropped, generated, consumed or forwarded by the Dell SonicWALL security appliance. You can position the mouse pointer over dropped or consumed packets to show the information listed in Table 19.
|
Module-ID = <integer> |
||
|
Drop-code = <integer> |
||
|
Reference-ID: <code> |
||
|
Module-ID = <integer> |
|
•
|
Length [Actual] - Length value is the number of bytes captured in the buffer for this packet. Actual value, in brackets, is the number of bytes transmitted in the packet.
|
|
•
|
Blade – The blade ID for handing this packet.
|
When you select a packet, you can use the keyboard shortcuts shown in Table 20. These shortcuts make it easy to navigate a large, multi-page display and to start/stop packet capture.
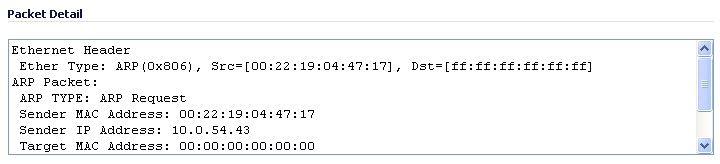
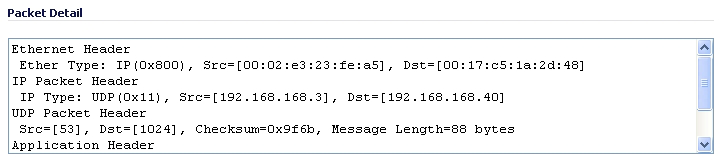
When you click on a packet in the Captured Packets section, the packet header fields are displayed in the Packet Detail section. The display varies depending on the type of packet that you select.
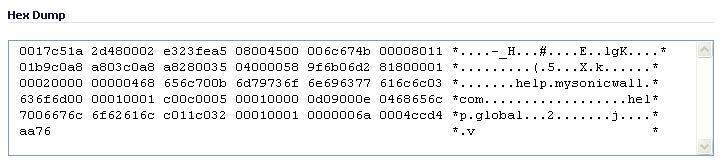
When you click on a packet in the Captured Packets section, the packet data is displayed in hexadecimal and ASCII format in the Hex Dump section. The hex format is shown on the left side of the dialog, with the corresponding ASCII characters displayed to the right for each line. When the hex value is zero, the ASCII value is displayed as a dot.