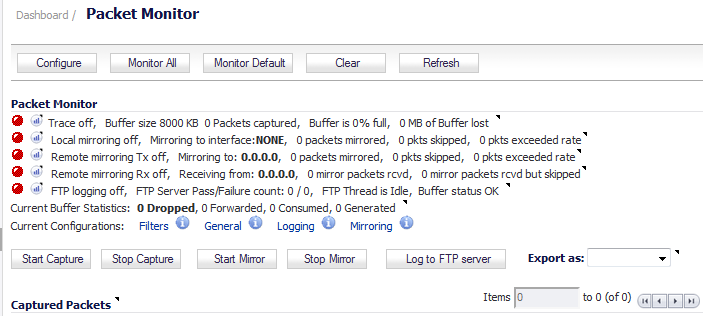
In addition to the Configure button, the top of the Dashboard > Packet Monitor page provides several buttons for general control of the packet monitor feature and display:
|
•
|
Configure – Displays the Packet Monitor Configuration dialog. For more information, see Configuring Packet Monitor.
|
|
•
|
Monitor All – Resets current monitor filter settings and advanced page settings so that traffic on all local interfaces is monitored. A confirmation dialog displays when you click this button.
|
|
•
|
Monitor Default – Resets current monitor filter settings and advanced page settings to factory default settings. A confirmation dialog displays when you click this button.
|
|
•
|
Clear – Clears the packet monitor queue and the displayed statistics for the capture buffer, mirroring, and FTP logging.
|
|
•
|
Refresh – Refreshes the packet display windows on this page to show new buffer data.
|
The Dashboard > Packet Monitor page is shown below:
For an explanation of the status indicators near the top of the page, see Understanding Status Indicators .
|
1
|
Navigate to the Dashboard > Packet Monitor page.
|
|
2
|
Optionally click Clear to set the statistics back to zero.
|
|
3
|
|
5
|
To stop the packet capture, click Stop Capture.
|
You can view the captured packets in the Captured Packets, Packet Detail, and Hex Dump sections of the Packet Monitor page. See Viewing Captured Packets .
You can start packet mirroring that uses your configured mirror settings by clicking Start Mirror. It is not necessary to first configure specific criteria for display, logging, FTP export, and other settings. Packet mirroring stops when you click Stop Mirror.
|
1
|
Navigate to the Dashboard > Packet Monitor page.
|
|
2
|
Under Packet Monitor, click Start Mirror to start mirroring packets according to your configured settings.
|
|
3
|
To stop mirroring packets, click Stop Mirror.
|
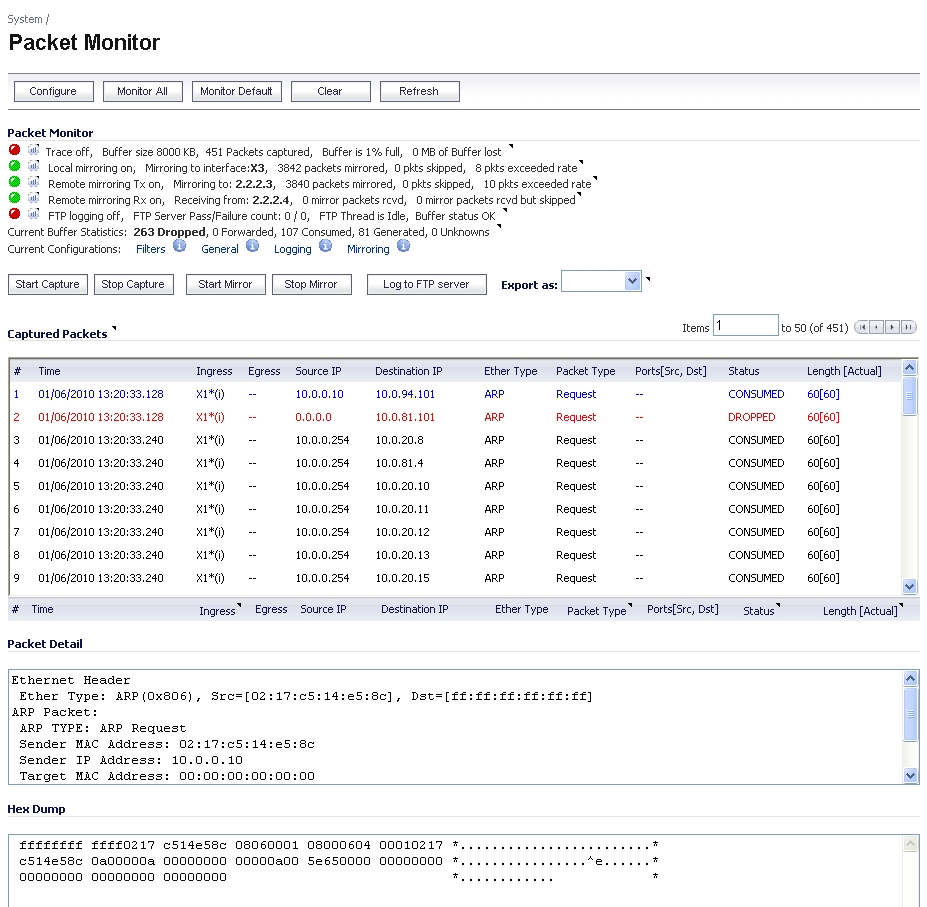
The Dashboard > Packet Monitor page provides three sections to display different views of captured packets:
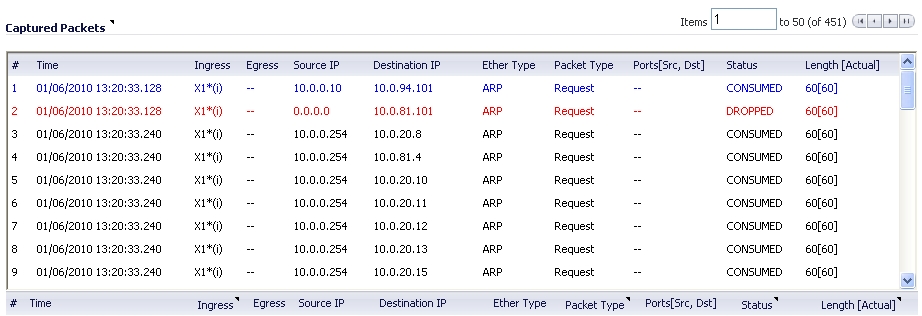
The Captured Packets section displays the following statistics about each packet:
|
•
|
# - The packet number relative to the start of the capture
|
|
•
|
Time - The date and time that the packet was captured
|
|
•
|
Ingress - The firewall interface on which the packet arrived is marked with an asterisk (*). The subsystem type abbreviation is shown in parentheses. Subsystem type abbreviations are defined in the following table.
|
|
•
|
|
•
|
Source IP - The source IP address of the packet.
|
|
•
|
Destination IP - The destination IP address of the packet.
|
|
•
|
Ether Type - The Ethernet type of the packet from its Ethernet header.
|
|
•
|
Packet Type - The type of the packet depending on the Ethernet type; for example:
|
|
•
|
Ports [Src, Dst] - The source and destination TCP or UDP ports of the packet
|
|
•
|
Status - The status field for the packet
|
|
Module-ID = <integer>
|
||
|
Drop-code = <integer>
|
||
|
Reference-ID: <code>
|
||
|
Module-ID = <integer>
|
|
•
|
Length [Actual] - Length value is the number of bytes captured in the buffer for this packet. Actual value, in brackets, is the number of bytes transmitted in the packet.
|
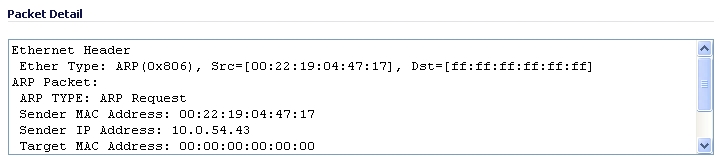
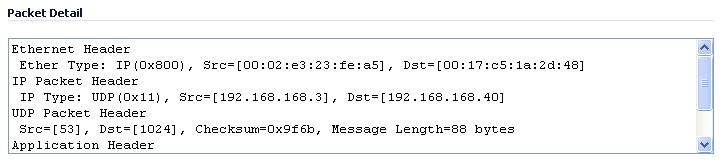
When you click on a packet in the Captured Packets section, the packet header fields are displayed in the Packet Detail section. The display varies depending on the type of packet that you select.
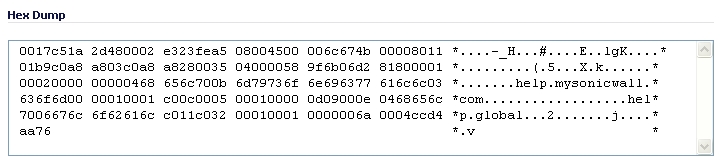
When you click on a packet in the Captured Packets section, the packet data is displayed in hexadecimal and ASCII format in the Hex Dump section. The hex format is shown on the left side of the window, with the corresponding ASCII characters displayed to the right for each line. When the hex value is zero, the ASCII value is displayed as a dot.