Dashboard : Dashboard > Real-Time Monitor

Bandwidth Monitor
The Ingress and Egress Bandwidth data flow chart provides a visual representation of incoming (Ingress) and outgoing (Egress) bandwidth traffic. The current percentage of total bandwidth used, average flow of bandwidth traffic, and the minimum and maximum amount of traffic that has gone through each interface is available in the display.
Flow Chart
The flow chart format overlaps the Bandwidth Interfaces; allowing you to view all of the Ingress and Egress Bandwidth traffic as it occurs. The x-axis displays the current time, and the y-axis displays the Ingress and Egress Bandwidth traffic.
Bar Chart
The bar chart format displays data pertaining to individual interfaces in a bar chart; allowing comparisons of individual Bandwidth Interfaces. In this chart, the x-axis denotes the Interfaces whereas the y-axis denotes the Ingress and Egress Bandwidth traffic.
Options
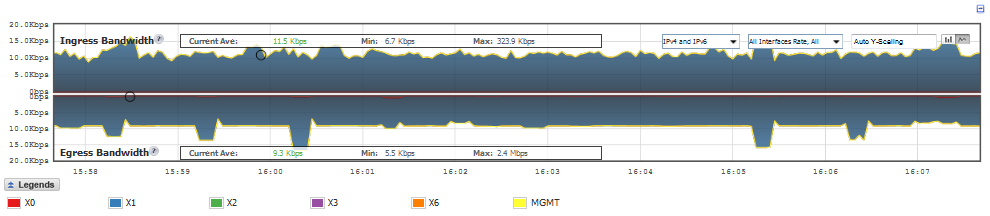
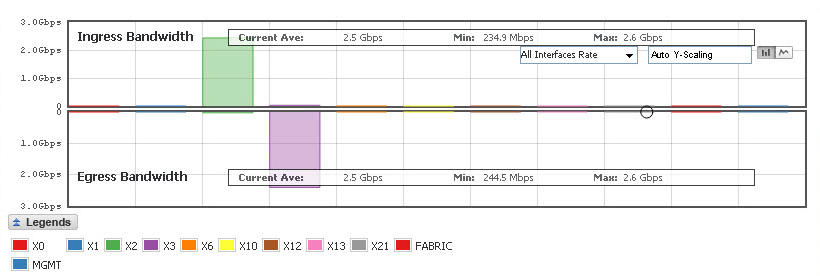
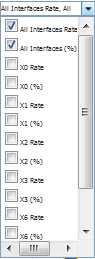
Options are available to customize the Display, Scale, and View of the Ingress and Egress Bandwidth charts. The following option is specific to the Bandwidth chart. For other options and display features, see Common Features .