The Dashboard > Packet Monitor page provides three section to display different views of captured packets.
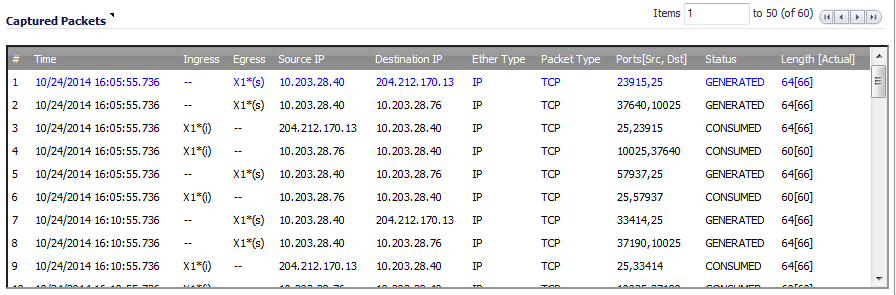
The Captured Packets section displays the following statistics about each packet:
|
•
|
# - The packet number relative to the start of the capture.
|
|
•
|
Time - The date and time that the packet was captured.
|
|
•
|
Ingress - The SonicWall appliance interface on which the packet arrived is marked with an asterisk (*). The subsystem type abbreviation is shown in parentheses:
|
|
•
|
Egress - The SonicWall appliance interface on which the packet was captured when sent out. The subsystem type abbreviation is shown in parentheses. See the table above for definitions of subsystem type abbreviations.
|
|
•
|
Source IP - The source IP address of the packet.
|
|
•
|
Destination IP - The destination IP address of the packet.
|
|
•
|
Ether Type - The Ethernet type of the packet from its Ethernet header.
|
|
•
|
Packet Type - The type of the packet, depending on the Ethernet type; for example:
|
|
•
|
IP packets: the packet type might be TCP, UDP, or another protocol that runs over IP.
|
|
•
|
PPPoE packets: the packet type might be PPPoE Discovery or PPPoE Session.
|
|
•
|
ARP packets: the packet type might be Request or Reply.
|
|
•
|
Ports [Src,Dst] - The source and destination TCP or UDP ports of the packet.
|
|
•
|
Status - The status field for the packet.
|
|
Module-ID = <integer> |
||
|
Drop-code = <integer> |
||
|
Reference-ID: <code> |
||
|
Module-ID = <integer> |
|
•
|
Length [Actual] - Length value is the number of bytes captured in the buffer for this packet. Actual value, in brackets, is the number of bytes transmitted in the packet. You can configure the number of bytes to capture. See Configuring General Settings.
|
You can select a packet to use as a filter by double clicking the packet. You can maneuver through the Captured Packets table by using the following keys:
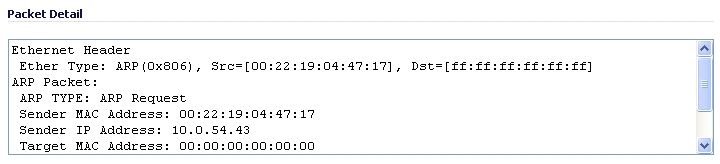
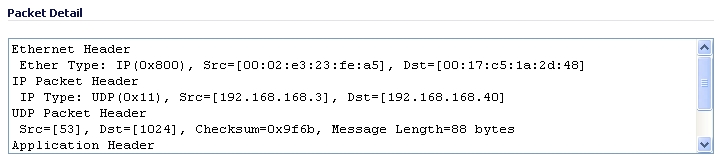
When you click on a packet in the Captured Packets section, the packet header fields are displayed in the Packet Detail section. The display varies, depending on the type of packet that you select.
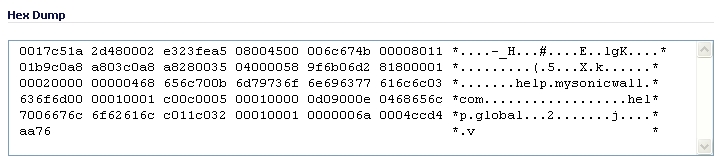
When you click on a packet in the Captured Packets section, the packet data is displayed in hexadecimal and ASCII format in the Hex Dump section. The hex format is shown on the left side of the window, with the corresponding ASCII characters displayed to the right for each line. When the hex value is zero, the ASCII value is displayed as a dot.