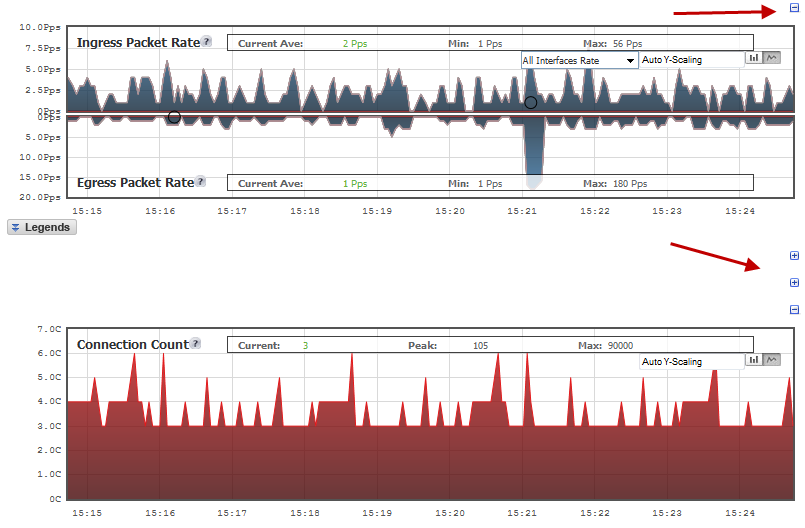
, that collapses the chart when it is clicked. When a chart is collapsed, a plus sign icon,
  , is displayed, which expands the chart when it is clicked. Collapsing charts is useful when you want to compare other charts closer together.
Directly above each chart, at the far right, is a minus sign icon, , that collapses the chart when it is clicked. When a chart is collapsed, a plus sign icon, , is displayed, which expands the chart when it is clicked. Collapsing charts is useful when you want to compare other charts closer together.