The Ingress and Egress Bandwidth data flow chart provides a visual representation of incoming (Ingress) and outgoing (Egress) bandwidth traffic. The current percentage of total bandwidth used, average flow of bandwidth traffic, and the minimum and maximum amount of traffic that has gone through each interface is available in the display.
|
NOTE: This Bandwidth Monitor is different from the Dashboard > BWM Monitor page (see Monitoring Interface Bandwidth Traffic ) in that the Bandwidth Monitor page is interface based instead of policy based.
|
|
•
|

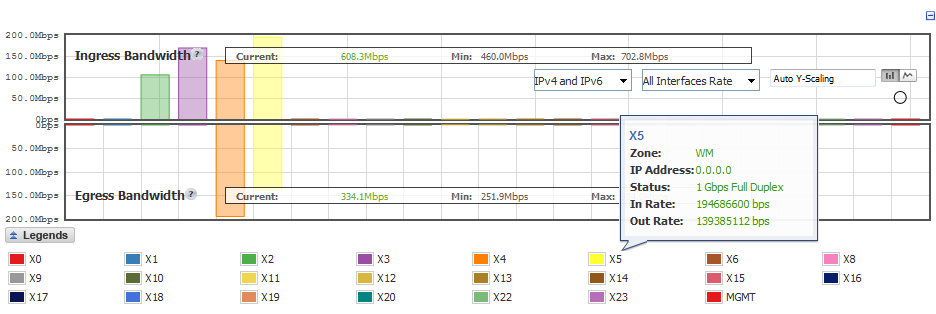
Options are available to customize the Display, Scale, and View of the Ingress and Egress Bandwidth charts. The following option is specific to the Bandwidth chart; see Table 7. For other options and display features, see Common Features .
|
|
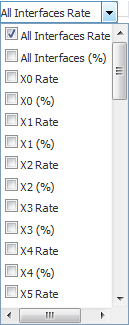
Specifies which Interfaces are displayed in the Bandwidth Flow Chart. A drop-down menu provides options to specify All Interfaces Rate (default), All Interfaces (%), or rate or percentage (%) for individual interfaces. |