This section describes several methods of verifying the correct configuration of Active/Active Clustering and Active/Active DPI. See the following:
When Active/Active DPI is enabled on a Stateful HA pair, you can observe a change in CPU utilization on appliances in the HA pair. CPU activity goes down on the active unit, and goes up on the standby unit.
You can view the CPU utilization on the Multi-Core Monitor. On the active firewall of the Master node, go to the System > Diagnostics page and select Multi-Core Monitor to show the activity of all appliances in the Active/Active cluster.
When viewing the Multi-Core Monitor on an active unit in the cluster, all firewalls in the cluster are displayed. However, if you log into the individual IP address of an standby unit in the cluster, the Multi-Core Monitor page only displays the core usage for the two firewalls in that particular HA pair.
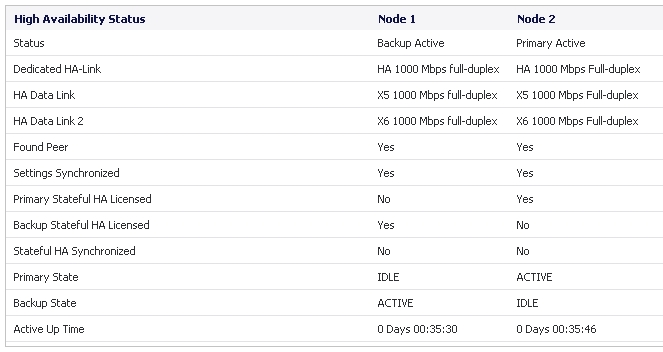
The High Availability > Status page provides status for the entire Active/Active cluster and for each Cluster Node in the deployment.
The Active/Active Clustering node status is displayed at the top of the page, and shows values for the following settings:
|
•
|
Node Status – Active or Standby for each node in the cluster
|
|
•
|
Virtual Groups Owned – Displays the Virtual Group number owned by each node in the cluster. You can check these values to determine the owner status after a failover.
|
The Active/Active Clustering Node Status table is shown below.

In the lower section of the page, the High Availability Status table displays the HA settings and status for each node in the cluster:
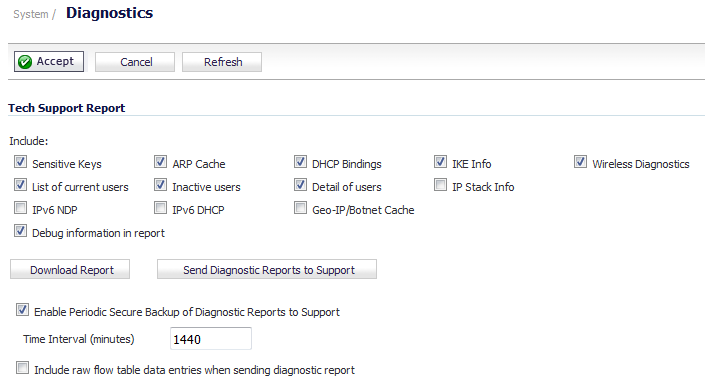
You can tell that Active/Active DPI is correctly configured on your Stateful HA pair by generating a Tech Support Report on the System > Diagnostics page. The following configuration parameters should appear with their correct values in the Tech Support Report:
|
3
|
Under Tech Support Report, click Download Report.
|
Responses, or actions, are always sent out from the active unit of the Stateful HA pair running Active/Active DPI when DPI matches are found in network traffic. Note that this does not indicate that all the processing was performed on the active unit.
Deep Packet Inspection discovers network traffic that matches IPS signatures, virus attachments, App Rules policies, and other malware. When a match is made, SonicOS performs an action such as dropping the packet or resetting the TCP connection.
Some DPI match actions inject additional TCP packets into the existing stream. For example, when an SMTP session carries a virus attachment, SonicOS sends the SMTP client a “552” error response code, with a message saying “the email attachment contains a virus.” A TCP reset follows the error response code and the connection is terminated.
These additional TCP packets are generated as a result of the DPI processing on the standby firewall. The generated packets are sent to the active firewall over the Active/Active DPI Interface, and are sent out from the active firewall as if the processing occurred on the active firewall. This ensures seamless operation and it appears as if the DPI processing was done on the active firewall.
If Active/Active DPI is enabled and DPI processing on the standby firewall results in a DPI match action as described above, then the action is logged on the active unit of the Stateful HA pair, rather than on the standby unit where the match action was detected. This does not indicate that all the processing was performed on the active unit.
High Availability related log events can be viewed in the Dashboard > Log Monitor page.
