The Log Monitor table provides numerous settings to allow you to navigate, view, and export results. Table columns can be customized, so that you can view full data on any event, or only the data you need. Table entries can be sorted to display in either ascending or descending order.
You can sort the entries in the Log Monitor table by clicking on the column header. The entries are sorted by ascending or descending order. The arrow to the right of the column entry indicates the sorting status. A down arrow means ascending order. An up arrow indicates a descending order.
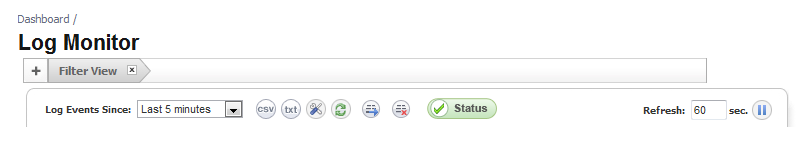
The top row of the Log Monitor table contains several functional items:
From the Log Events Since menu, you can select the time interval in which to view log events. Time intervals range from the last 30 minutes to the last 30 days, or all log events in the database.
The functional buttons perform various functions of the Log Monitor. Pausing your cursor over a button reveals the description of the button.
![]()
The following table describes the button functions:
At the far right of the table, in the Refresh field, you can specify how often the Log Monitor table is updated with events from the event log database. The default is to refresh every 60 seconds, but other intervals can be specified. To refresh all output immediately, click the pause/play toggle button to the right of the Refresh box.
![]()
The pause/play toggle button starts or stops the Log Monitor table from updating its content. This is useful in cases where the Log Monitor table is very busy and is being updated continually in quick succession. Users can pause the screen from updating long enough to inspect the messages.
The Log Monitor is displayed in a table and can be sorted by column.
|
1
|
Click the Tools button.
|
![]()
The Select Columns to Display popup window appears.

|
3
|
Click Apply.
|
The default log table columns include:
|
•
|
Time - The date and time of the event.
|
|
•
|
ID - Identifying number for the event. ID is most useful when using GMS or Syslog. The ID is shown in Syslog packets and is used to identify data in generated reports.
|
|
•
|
Category - To make it easier to find and configure the settings for an event, events can be displayed by Category, Group, or Event, as selected from the Select Columns to Display dialog.
|
|
•
|
Priority - The level of priority associated with your log event. Syslog uses eight priorities to characterize messages: Emergency, Alert, Critical, Error, Warning, Notice, Informational, and Debug.
|
|
•
|
Src. Int - Displays source network and IP address.
|
|
•
|
Dst. Int - Displays the destination network and IP address.
|
|
•
|
Src. IP - Displays the source IP address.
|
|
•
|
Src. Port - Displays the source port.
|
|
•
|
Dst. IP - Displays the destination IP address.
|
|
•
|
Dst. Port - Displays the destination port.
|
|
•
|
IP Protocol - The IP protocol (TCP or IP) in use
|
|
•
|
User Name - Displays the name of the originating user
|
|
•
|
Application - Displays the application accessing the network.
|
|
•
|
Notes - Provides dynamic, detailed information about the event.
|
|
•
|
Message - Provides a general description of the event.
|