|
NOTE: For increased convenience and accessibility, the Multi-Core Monitor also can be accessed either from the Dashboard > Multi-Core Monitor, Dashboard > Real-Time Monitor, or System > Diagnostics page. The Multi-Core Monitor display on the System > Diagnostics page is identical to that of the Dashboard > Multi-Core Monitor. Both monitors display information about single cores. The Dashboard > Real-Time Monitor shows the information either for combined data in flow chart format or for individual cores in bar chart format.
|
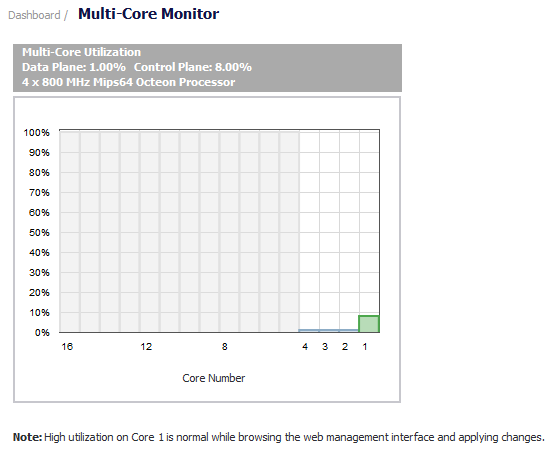
The Multi-Core Monitor displays dynamically updated statistics on utilization of the 18 to 32 individual cores of the Dell SonicWALL network security appliance. The number of cores depends on the model of the appliance.