Reporting : Using the Log Analyzer

Using the Log Analyzer
The Log Analyzer allows advanced users to examine raw data for status and troubleshooting. The Analyzer logs contain detailed information from the system logs on each transaction that occurred on the specified SonicWALL appliance. These logs can be filtered or drilled down to further narrow the focus of the information, allowing analysis of data about alerts, interfaces, bandwidth consumption, and so on. The Log Analyzer is only available at the individual unit level.
Log information can be saved for later analysis and reloaded from Custom Reports.
To load a report for viewing, either:
Click Load Custom Report and select from the pull-down list of saved Custom Reports.
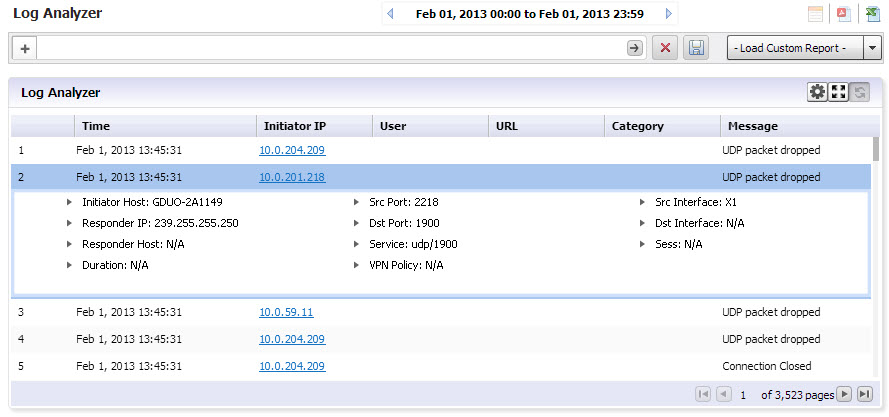
Click on Analyzers > Log Analyzer to view the current log.
Viewing the Log Analyzer
The log displays information specific to either a particular report or overall system information, depending on the path used to reach the log, either from the individual report level or from the Log Analyzer entry on the Reports tab. Entries in the Analyzer log vary, according to the relevant report type. You can customize the log entries by using the following options:
Show/Hide Log Columns
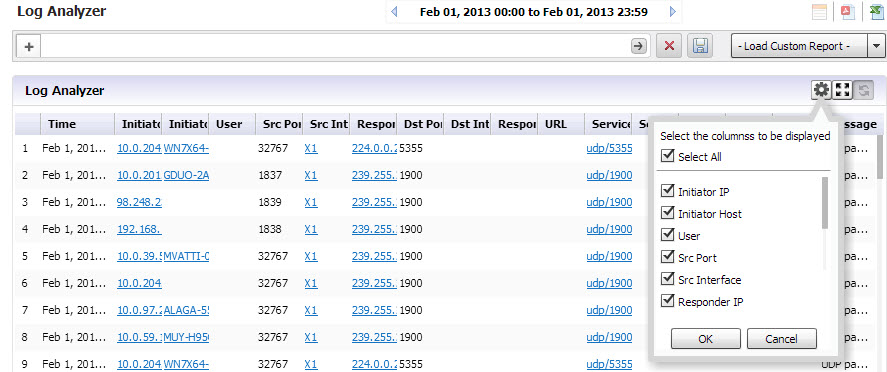
Use the Show/Hide Columns function to hide columns that you do not want to display in the Analyzer Log. Just click the Configure the Log Analyzer icon, then select the columns that you want to display and deselect the ones that you do not want to display. By configuring the displayed columns, the Log Analyzer gives a more clean, concise, and meaningful way to view the logs, instead of displaying unnecessary columns that take up valuable real estate.
Row-Based Expansion
Instead of showing all the column information at the same time, the row-based expansion simplifies the screen and gives on-demand information through a single click.
Click on each row to pull down the hidden column information.
Full Screen Mode
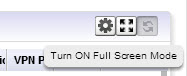
Switch to full screen mode by clicking the Full Screen Mode toggle icon. This populates the entire browser screen with the Log Analyzer page, hiding the tree control and reports panels.
Session-Based Configurations
All column configurations for the Log Analyzer are recorded in each session. This is so that within the session, users can have the desired/configured tabular view of the Log Analyzer at all times.
Priority
The log event messages are color-keyed according to priority. Red is the highest priority, followed by yellow for Alerts. Messages without color keys are informational, only. The color categories are:
Color keys allow you to immediately focus on the priority level of the message, and filter data accordingly.
Filtering the Analyzer Log
The Log Analyzer allows you to add filters to view user-or incident-specific data. The Log analyzer can be reached either by drilling down in individual reports, or from the Analyzers item under the Reports tab.
To view the Analyzer Log, complete the following steps:
1
Click the Reports tab.
2
3
Click to expand the Analyzer tree and click on Log Analyzer. The saved Log Analyzer report page displays.
 
4
Available filters include filters for Application, Category, DST Interface, DST Port, Duration, Initiator Country, Host, or IP address, Interface, Message, Priority, Responder country, IP, or Name, Service, Session, Src Interface, Src Port, URL, User, or VPN Policy. This full list is available from the Log Analyzer Entry.
If you are viewing the log in the Log Analyzer view for a specific application entry, only those filters specific to that entry are available.
Log views are drillable, and will add filters as column entries are drilled. Click on an entry of interest to add a filter and further constrain the information displayed.
Log Analyzer Use Case
In the following use case, we will sort and filter the captured event information to evaluate threats targeted toward the X0 default interface.
On the Reports tab, click on Analyzers > Log Analyzers.
 
1
2
Type in X1 to specify the default interface filter.
3
Click Go.
The Log Analyzer is filtered on the X1 port interface.
 
This allows you to begin debugging, or further investigate use of the database.
More information can also be found by using Universal Scheduled Reports.