Console : Summarizer Status

Summarizer Status
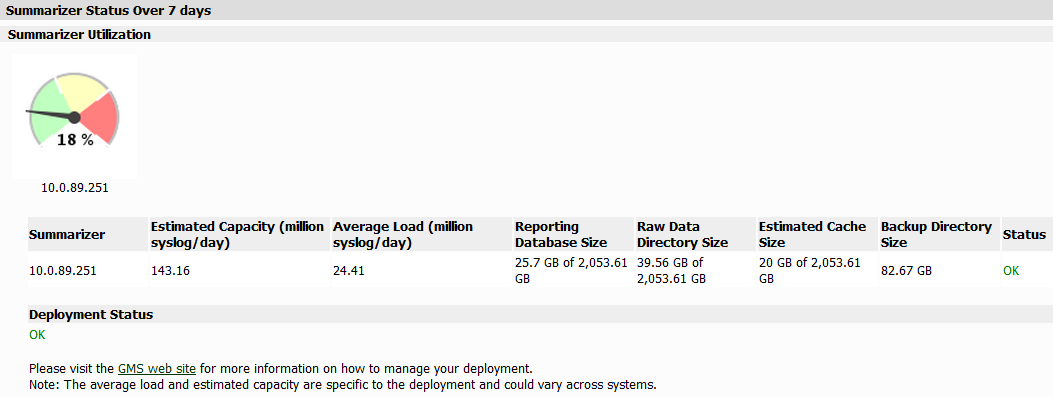
The Summarizer Status page displays overall summarizer utilization information for the deployment including database and syslog file statistics, and details on the current status of the summarizer.
The Summarizer Status screen provides performance metrics for your network administrator to plan, design, and expand your GMS server deployment. This feature has information on the Syslog Collector and Summarizer metrics. The metrics displayed are daily averages collected over the last 7 days.
You can receive alert emails when Summarizer Status shows any abnormalities.
To reach the Summarizer Status screen, navigate to the Console panel of GMS and then to Diagnostics > Summarizer Status.
The Summarizer Status page is divided into a section showing the overall deployment-wide summarizer status and sections with details for each summarizer. See the following sections:
Summarizer Status Over 7 Days
The Summarizer Status Over 7 Days section displays overall summarizer utilization information for the deployment including database and syslog file statistics. Results are calculated over the last seven days.
Summarizer Utilization
The top Summarizer Utilization section shows the average utilization of the summarizer over the applicable time period. The Dial Charts show the percent of total capacity used by the Summarizer. The following metrics are also displayed in the Summarizer Utilization section:
Summarizer: Displays the IP address of the Summarizer.
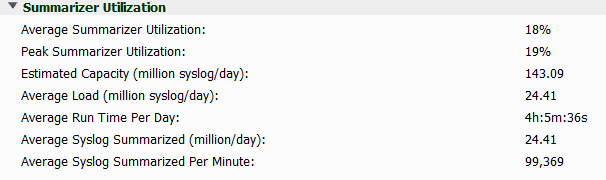
Estimated Capacity (million syslog/day): The estimated capacity of the system. This is calculated by taking the (average load per day) and dividing it by the (time spent), assuming that the Summarizer was to constantly summarize 24 hours (as in the case of a dedicated Summarizer).
Average Load (million syslog/day): The number of incoming syslogs per day.
Reporting Database Size: Displays the size of the reporting database in gigabytes.
Raw Data Directory Size: Displays the size of the raw syslog directory in gigabytes.
Estimated Cache Size: Displays the estimated size of the cache in gigabytes.
Backup Directory Size: Displays the size of the backup directory in gigabytes.
Status: Displays the status of the Summarizer. There are three different status notifications:
OK: The system is operating normally.
High Capacity: The average load is greater than 90 percent of capacity.
Low Disk Space: There is less that 5GB of space left on the disk.
Deployment Status
The Deployment Status tells the user how the deployment should be sized if it is not performing well. The user might need to reassign some units to a different agent, add another agent, or add more disk space
Details for Summarizer at <IP Address>
This sections details the Summarizer Utilization for the applicable IP address.
Summarizer Utilization
The Summarizer Utilization section for a specific summarizer shows not only the information at deployment level, but also provides granular details of the summarizer’s operation and current status for each individual summarizer.
NOTE: Not all syslogs are summarized. Some syslogs are discarded based on criteria defined at the Console > Reports > Syslog Filter and Unit > Reports > Configuration > Syslog Filter pages.
Data File Information
This section displays syslog file details for the selected summarizer.
The Data File Information table is divided into three columns:
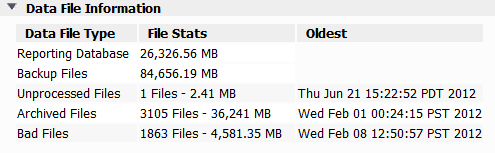
Data File Type: The type of files being reported on.
There are five main data file types:
File Stats: The number of syslog files in the category and their size in Megabytes.
Oldest: The date and time on the oldest file in the category.
Summarizer Process Details
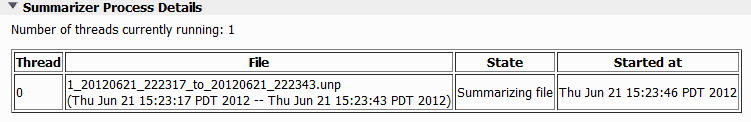
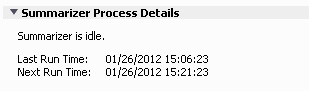
The Summarizer Process Details section shows what tasks the summarizer is performing at the moment the Console > Diagnostics > Summarizer Status page displays. Refresh your browser display or leave the page and return to it to update the information.
If the summarizer is currently running, the page displays the thread, appliance identifier, file being used, and state of the summarizer.
If the summarizer is currently idle, the page displays the last run time and next run time.
Syslogs sent by appliances that are not under Reporting and Management
Appliances that are no longer managed by the GMS might still send syslog messages, impacting the performance of the summarizer. The syslogs from such appliances are dropped and not stored in archivedSyslogs or badSyslogs folders.
This feature displays a list (refreshed every 12 hours) of the appliances that are still sending syslogs messages even though they are no longer managed by GMS, as well as appliances that are incorrectly configured:
If your GMS has a list of appliances in these fields, try the following to correct the issue: