|
||||||||||||||||||||
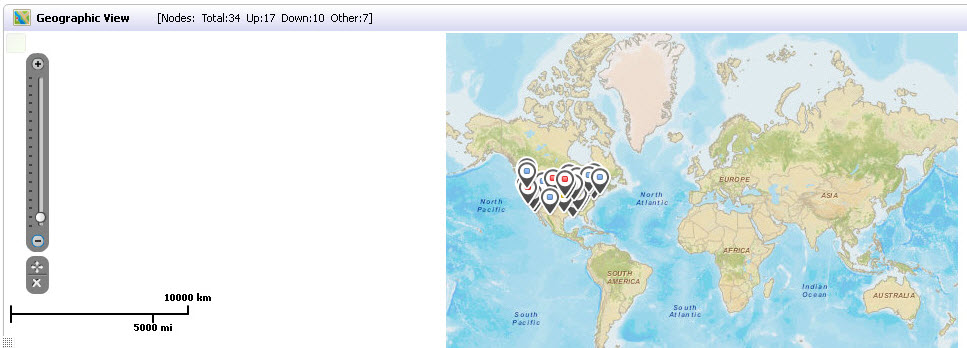
Because many SonicWALL GMS deployments contain dispersed devices in many different cities and countries around the world, you can view all the objects at once by clicking Show all the objects on the Map. This button is located below the minus (-) button on the zoom bar.
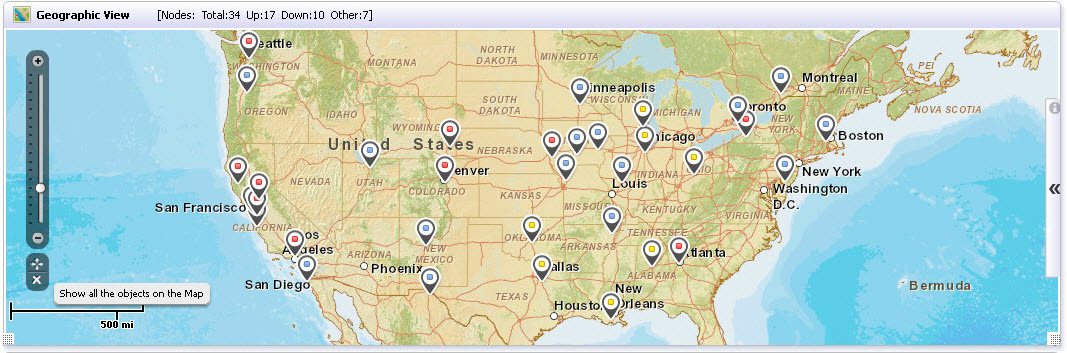
In this example, the entire SonicWALL GMS deployment of SonicWALL GMS hosts and managed devices are located in the continental United States map. Therefore, clicking Show all objects on the Map displays all the nodes for this deployment in the continental United States map. To save this Geographic View, click on the floppy disc icon on the Dashboard control panel.
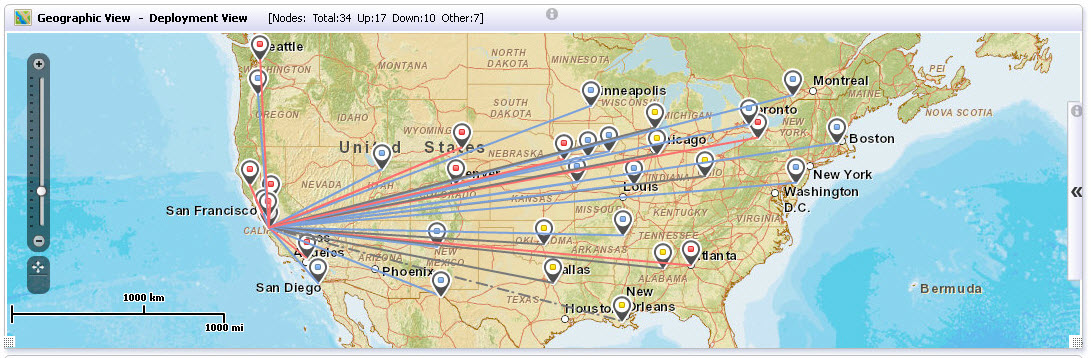
To change the Dashboard Geographic View default view to the “Deployment View,” point your mouse cursor on the Map. Right-click the Map, and select Deployment View. The Deployment View provides the location of your SonicWALL GMS hosts with graphical color lines to each SonicWALL GMS-managed device as shown below.
To change the Dashboard Geographic View default view to the “VPN Monitor View,” point your mouse cursor on the Map. Right-click the Map, and select VPN Monitor View.
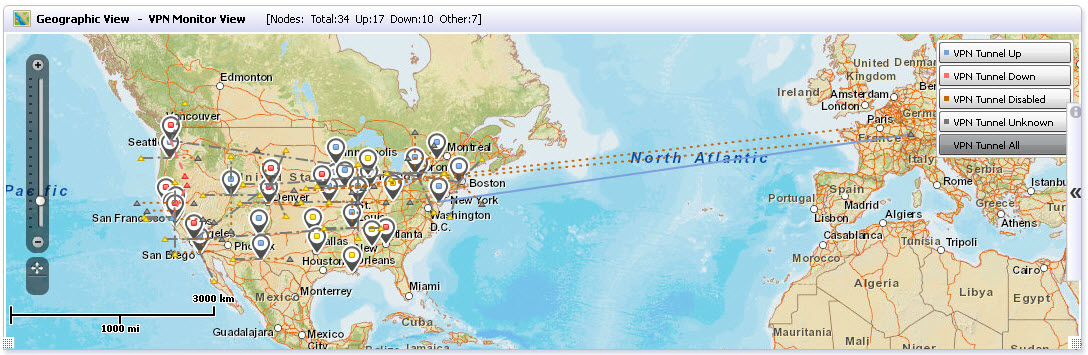
For more information on configuring your SonicWALL GMS-managed firewall VPN settings, refer to the Firewall > Policies > VPN > Settings page.
|
|
|
|
|
|
|
|
|
|
|
|
|
|
|
|
|
|
|
|
|
|
|
|
|
|
|
|
|
|
|
|
|
|
|
|
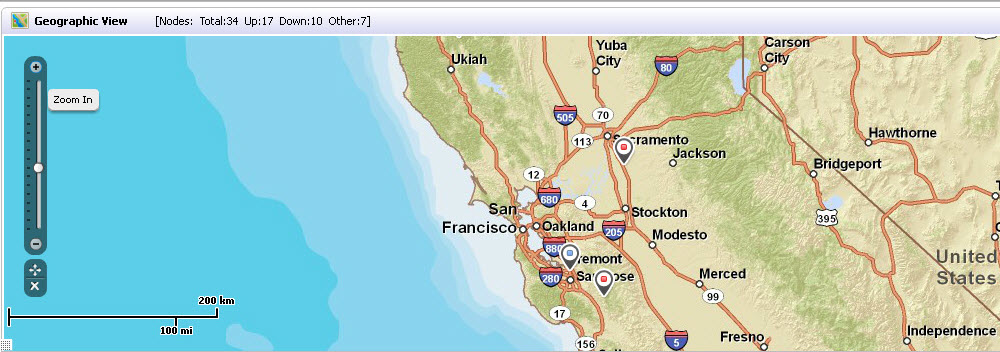
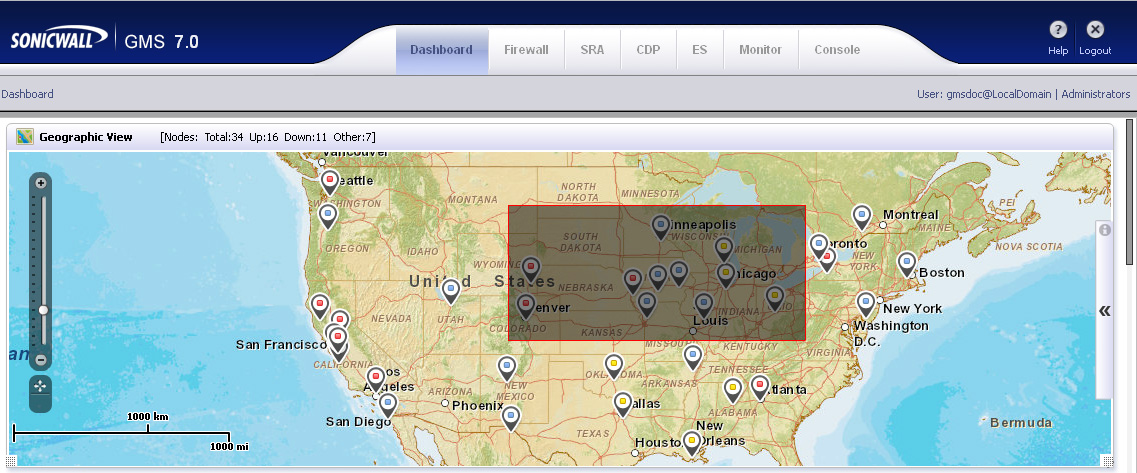
Selecting a group of nodes on the Geographic Map can be completed by holding Ctrl while clicking the nodes one at a time. Alternatively, you can select a group of nodes on the Geographic Map by holding the shift key and dragging your mouse cursor around the map region as illustrated in the following image.
|
•
|
Logs—Displays the log event message, the friendly name of the SonicWALL device, and the date timestamp.
|
|
•
|
Sites—Displays site IP, browse time, hits, and the amount of data transferred.
|
|
•
|
Alerts—Displays the alert message and the last reported time.
|
|
•
|
Applications—Displays application category, events, and the amount of data transferred.
|
|
•
|
Scheduled Tasks—Displays the description of each scheduled task, the friendly name of the SonicWALL device, and the local time of the schedule.
|
|
•
|
Threat Category—Displays Top Intrusion/Anti-Spyware/GAV Categories and Top Attacks including respective action and event messages.
|
|
•
|
Data Usage—Displays a Timeline graph and a list of Top Protocols including protocol service name, number of connections, and the amount of data transferred.
|