Introduction : Overview of GMS

Appliance Panels
The appliance panels enable administrators to add, delete, configure and view various SonicWALL appliance types managed by SonicWALL GMS. These panels include:
Firewall Panel—Provides centralized management and reporting on compatible firewall appliances.
SRA Panel—Provides centralized management and reporting on SonicWALL SRA and Aventail appliances.
CDP Panel—Provides centralized management and reporting SonicWALL Continuous Data Protection appliances.
ES Panel—Provides centralized management of SonicWALL Email Security appliances.
Within the Firewall, SRA, and CDP panels are two sub-panels:
Policies Panel
The Policies Panel is used to configure SonicWALL appliances. From these pages, you can apply settings to all SonicWALL appliances being managed by the GMS, all SonicWALL appliances within a group, or individual SonicWALL appliances.
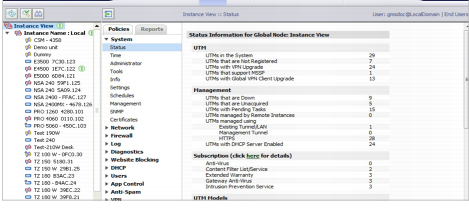
To open the Policies Panel, click the Firewall tab at the top of the SonicWALL GMS management interface and then click the Policies tab. The SonicWALL appropriate appliance Policies Panel appears:
Reports Panel
The Reports Panel is an essential component of network security that is used to view and schedule reports about critical network events and activity, such as security threats, inappropriate Web use, and bandwidth levels.
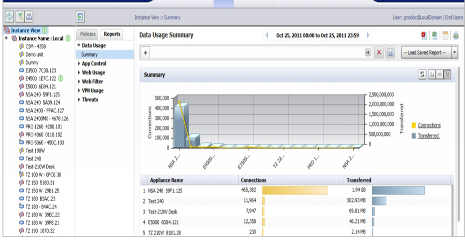
To open the Reports Panel, click the Firewall, SRA, or CDP tab at the top of the SonicWALL GMS UI and then click the Reports tab.
In the Reports Panel, you can simultaneously expand multiple screen groups, allowing you to compare them. Use Control-click (Windows) to toggle the screen group to the expanded group, without collapsing previously-opened screen groups.
Monitor Panel
The Monitor Panel is the administrator’s central tool for monitoring the status of any managed TCP/IP and SNMP capable devices and applications. The SonicWALL GMS Monitor panel provides power and flexibility to help you manage availability of network devices, creating custom threshold-based realtime monitor alerts and emailing or archiving network status reports based on your specifications.
To access the Monitoring features, click the Monitor tab at the top of the GMS management interface.
Console Panel
The Console Panel is used to configure the GMS settings, view pending tasks, manage licenses, and configure system wide granular event management settings.
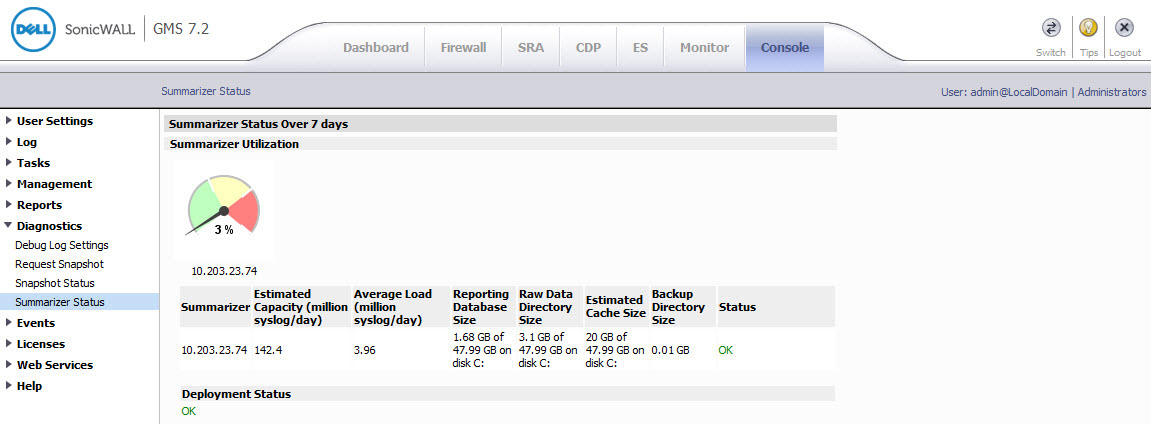
To open the Console Panel, click the Console tab at the top of the GMS management interface.