The default display mode is Show Chart and Grid. In this mode, the data is available for viewing as both a ‘Chart’ and a ‘Grid.’ This layout can be controlled by switching between 3 display mode options, any of which can be turned on/off at any time, using the utility toggle button group on the Section Title Bar.
|
•
|
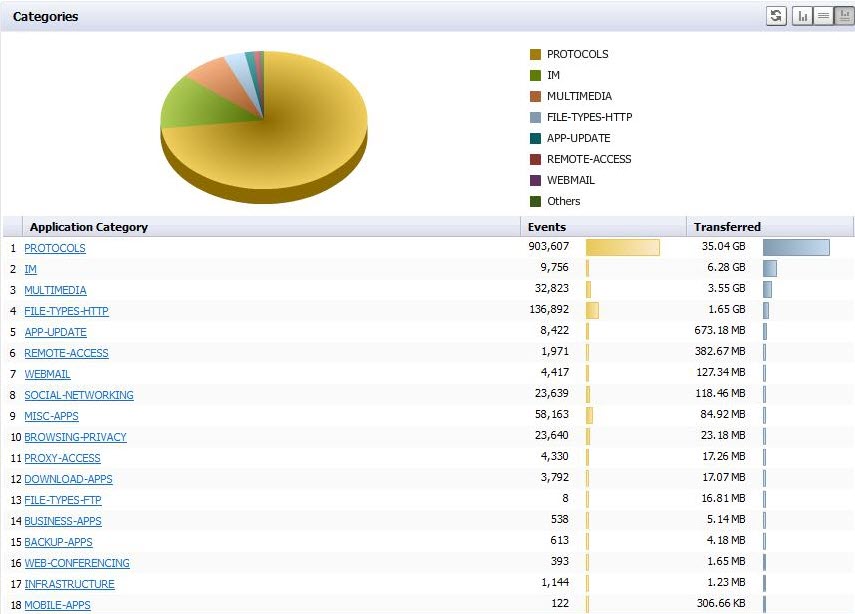
Show Chart: In this mode only the chart is visible and takes up all the available space inside the section container. Charts show a timeline or pie chart.
|
|
•
|
Show Grid: In this mode only the Grid is visible. The Grid Display might contain more than one Section,
|
|
•
|
Show Chart and Grid: In this mode both the chart and the grid are visible and are vertically stacked.
Switching between these modes is handled through the utility toggle buttons. |
Reload Data  is present on the title bar in all the layouts described previously. Clicking this button instructs the application to refresh the section data.