Reporting : GMS Reporting Overview

Drilling Down
Sections in the Grid display might contain drillable columns, containing hypertext links to bring up a Detail Report. A ‘drillable’ column appears as a column in the data grid, where the child values appear underlined and in blue, and act as a hyperlink to additional information. Click any of these values to drill down to another report, using the value on which drill-down has been executed as a filter. When you click on a drillable link, this filter is added to the Filter Bar.
Drilling down navigates to a new Detail report, filtered by the data on which the drill-down was executed. Drillable reports can display multiple grid sections in the sub-reports, or bring up a System Analyzer view, depending on the item selected.
The following example illustrates how you can drill down through the Data Usage Report by clicking on a drillable entry to gain more information and filter the results.
1
Click on an appliance, then click Data Usage on the Reports tab. You will see a timeline showing connections.
 
2
 
3
To further filter the output, to view only tcp/https usage, click on the tcp/https entry under Services. A Detail report, filtered to show only usage of tcp/https, comes up. Notice that a Service entry has been added to the Filter Bar.
 
Notice that the Report now focuses on the filter constraint from the drilled-down column.
Because this report also contains drill-down areas, you can drill down even further to add additional constraints to the results.
 
The Log Analyzer provides the most detailed Report information.
4
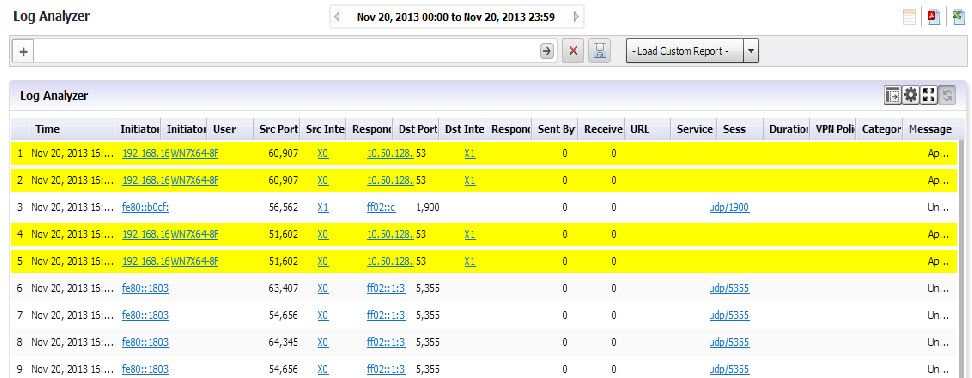
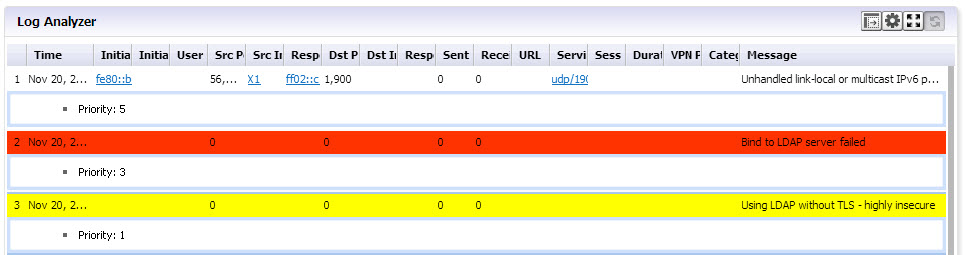
To view the Log Analyzer, go to the Reports tab after you have drilled down to the desired level of detail and click on Analyzers > Log Analyzer.
The Log Analyzer contains information about each connection, including port and interface information, number of Bytes sent, and so on.
You can drill down through the Log Analyzer Report as well. Clicking on a column item adds an additional filter and narrows down your results, allowing you to zoom in on specific instances.
Some Log Analyzer reports can be reached as the final step of a drill down process.
Click on a row to expand the log, additional information can be viewed here:
The bottom bar of the Log Analyzer contains a page bar that allows you to navigate through the report by paging forward and backward, or going to the specific page of interest.