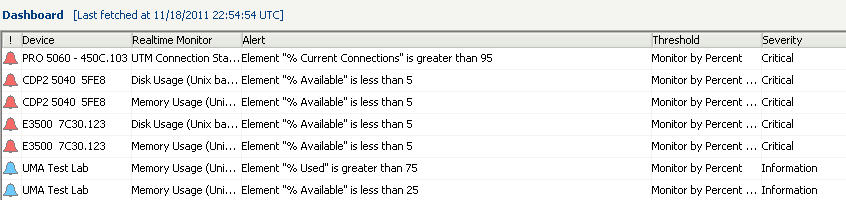
Configuring Severity and Thresholds allows you to be notified when the value of a monitored OID exceeds a set level. These levels are set in the Manage Severity dialog and are then used to define your alerts by assigning a level of severity to each threshold, set in the Manage Threshold dialog.
The Severities and Thresholds are now linked to the Granular Events Management (GEM) framework. This allows you to configure severities and thresholds from the Net Monitor tab, or navigate to the Console > Events screen to configure and verify changes there.
|
1
|
In the menu bar, select Tools > Manage Severity.
|
|
1
|
In the menu bar, select Tools > Manage Thresholds.
|
|
2
|
Click
|
|
3
|
Click
|
|
4
|
You might also disable a specific threshold by selecting Disabled. The following threshold triggers a Low-level Warning at a value of less than 100000 bytes.
|
5
|
Click Apply to save your changes.
|
You can schedule reports from realtime monitors to be sent by email or archived to a location on disk. To create a scheduled report, navigate to the Dashboard> Universal Scheduled Reports screen:
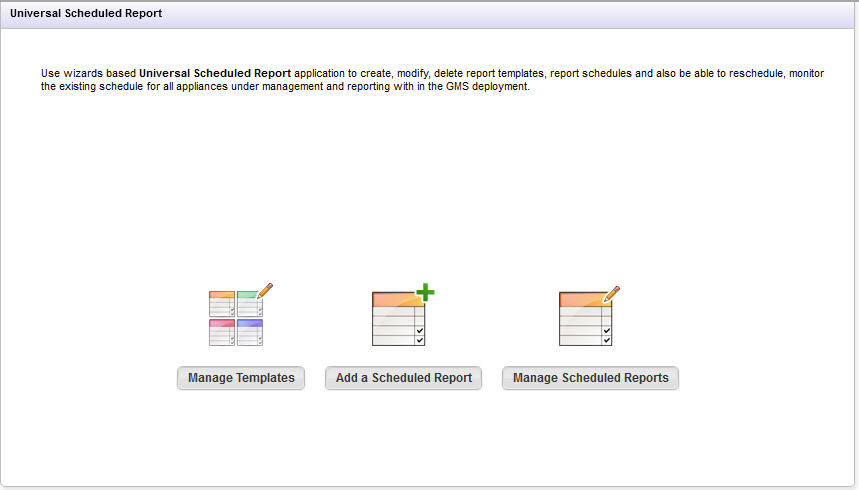
For more information regarding managing SNMP Schedule Reports, refer to Using the Universal Scheduled Reports Application .
|
2
|
In the menu bar, select Tools > Alert Settings.
|
|
3
|
Click Add Destination to add a new destination. You are able to add a maximum of five destinations/schedules.
|
|
6
|
Select whether you want these settings applied to just the Selected Device or All Accessible Devices. Note that selecting the latter option will overwrite any existing settings for the affected devices.
|
|
7
|
Click Apply to complete adding alerts. A warning could display notifying you that the Alert Settings is reset to the newly specified settings. Click Yes to continue.
|
|
•
|