|
1
|
In the GMS management interface, go to Monitor > Tools > Live Monitor.
|
|
2
|
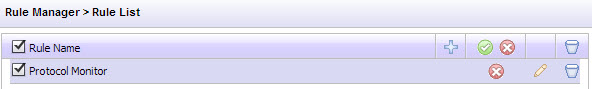
Click Manage Rules in the Control bar.
|
The Rule Manger > Rule List pop-up window displays:
|
3
|
To add a new rule, click the Add New Rule icon.
|
The Rule Manager > Rule Settings panel displays:
|
4
|
Fill in the Name text-field to utilize a more descriptive name for this new rule.
|
|
5
|
If you wish to build a rule without immediately enabling it, click Disable. Leaving this check box blank sets the rule as enabled in the Rule List, after it is built.
|
The Severity drop-down menu allows you to set a different severity level tag for each syslog that meets the conditions of this rule.
|
6
|
Click the Severity drop-down menu, and then select the desired severity level:
|
|
•
|
|
•
|
|
7
|
Created a rule using the available templates. Under the Group heading, you will find the available templates.
|
|
•
|
Under the Generic rules group, a listing of rule templates display. Clicking on one of these types allows the full rule to display below in the Rule Editor box.
|
|
•
|
The Computational rules group provides average-based statistical alerts on syslogs received, further broken down by number received for appliances, or the number of syslogs received grouped by appliance.
|
|
•
|
The Attack rules group offers rules to understand the number of appliances under attack from security threats, and for identifying specific appliances under attack.
|
|
•
|
The Advanced rules group is a flexible template that allows syslogs to be filtered based on one or two conditions.
|
|
8
|
To edit the rule conditions, click on the Rule Editor (pencil) icon.
|
For a list of the current SonicOS Log Events, click the Event Log Reference Guide link.
|
9
|
If you are done with the Rule Settings configuration, click Finish. If you wish to configure the alert destination and schedule, click Next and refer to Setting Alert Destination and Schedule .
|
|
1
|
To set the destination and schedule for alerts based on a created rule, click the Add Destination link.
|
To open additional destination fields, up to the maximum of five, you might click again on Add Destination.
|
2
|
Click the Destination drop-down menu and select a destination:
|
|
3
|
Click the Schedule drop-down menu, and then select the frequency this destination receives alerts based on this rule:
|
|
•
|
|
•
|
|
•
|
|
5
|
Click OK to close the dialog box and to return to the Rule Manager > Rule List panel. The newly created rule displays in the list:
|
After you have built and enabled the rules you want the event correlation engine to apply against the syslogs, click Close to return to the Live Monitoring user interface.