Monitoring : Net Monitor

Using the Live Monitor Management Interface
This section details the action items in the Live Monitor management interface including the control bar, scrolling navigation, and alert event detail.
Control Buttons
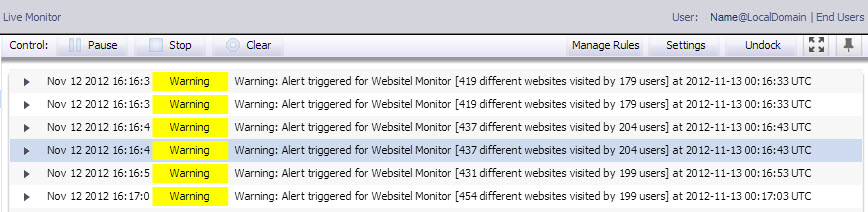
Click Start in the Control bar to begin Live Monitoring. It takes 15-30 seconds for entries to display in the list.
After alerts are received, they will begin to appear in the user interface.
The control bar displays Start and Clear buttons to control the flow of alerts on the screen:
Start— Starts the Live Monitor feature, allowing alerts to display in the list.
Clear— Clears all alerts in the LIve Monitor list.
 
After Live Monitoring begins, Start is replaced by Pause and Stop.
Pause— This button is helpful if you need to focus on one alert, while keeping the buffer from continuing to fill up with alerts.
Stop— Stops Live Monitoring from receiving alerts to display. Keep in mind there is a 15-30 second lag before the event engine sees the Live Monitoring user interface is no longer listening.
If alerts are paused, the control bar displays a Resume button in place of Pause.
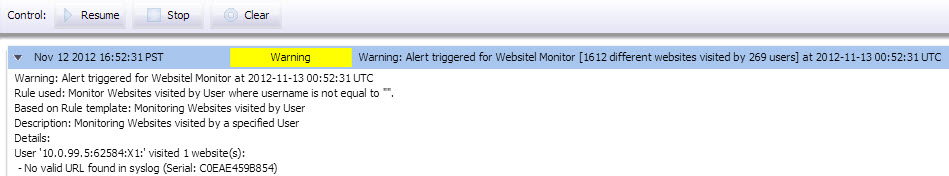
Resume— Click when you are ready to resume Live Monitoring.
Display Settings
The Live Monitor Control bar displays Undock, Dock, Full Screen and Pin icons to change the Display options.
Full Screen— Displays the LIve Monitor in a full screen mode. Press Escape to return to the Live Monitor management interface.
Pin— Pins or Un-pins the Control bar from the Live Monitor page. If the Control bar is un-pinned, hover the mouse over the top of the page and the Control bar drops down, click the Pin icon to keep it displayed.
Undock— Undocks the Live Monitor from the Monitor > Live Monitor management interface page, giving you the option to view the Live Monitor in a new window.
Dock— Docks the Live Monitor to the Monitor > Live Monitor management interface page.
Scroll Navigation
The right side of the Live Monitoring management interface contains a scroll bar. As alerts are displayed, the most recent appear at the bottom of the buffer in “auto-scroll” mode. Clicking on other scroll bar controls disables auto-scroll, giving command to the user. There is a button next to the scroll bar on the top to Enable/Disable Auto Scrolling. The scroll bar’s up and down “arrow” buttons provide a smooth and fast scroll movement in the display.
Alert Event Detail
Within the Live Monitoring management interface display, you can see greater detail about a particular alert by double-clicking on the alert. This expands the field to show additional information, including the RAW Packet information. To collapse the alert details, double-click on the alert again.
The Live Monitoring user interface can be viewed by multiple users at the same time. However, if no users are actively monitoring, alerts are no longer sent to the interface. Alerts continue to be sent to previously set destinations, such as email and traps.
Dell SonicWALL suggests referencing the following documents as essential tools to effectively use the Live Monitoring feature:
SonicWALL Knowledge Base articleSetting Up GMS Live Monitor for Alerting
SonicWALL Log Event Reference Guide— http://documents.software.dell.com/doc227946