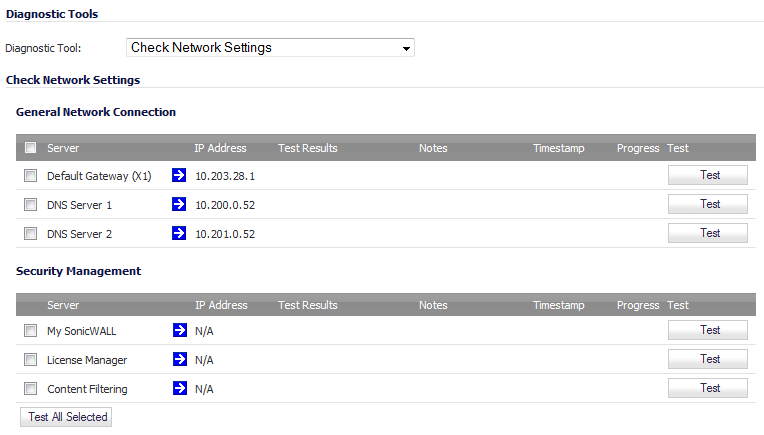
Check Network Settings is a diagnostic tool which automatically checks the network connectivity and service availability of several pre-defined functional areas of SonicOS, returns the results, and attempts to describe the causes if any exceptions are detected. This tool helps you locate the problem area when users encounter a network problem.
Specifically, the Check Network Settings tool automatically tests the following functions:
The return data consists of two parts:
|
•
|
Test Results – Provides a summary of the test outcome
|
|
•
|
Notes – Provides details to help determine the cause if any problems exist
|
The Check Network Settings tool is dependent on the Network Monitor feature available on the Network > Network Monitor page of the SonicOS management interface. Whenever the Check Network Settings tool is being executed (except during the Content Filter test), a corresponding Network Monitor Policy appears on the Network Monitor page, with a special diagnostic tool policy name in the form “diagTestPolicyAuto_<IP_address/Domain_name>_0”.
To use the Check Network Settings tool, first select it in the Diagnostic Tools drop-down list and then click the Test button in the row for the item that you want to test. The results are displayed in the same row. A green check mark ![]() signifies a successful test, and a red X
signifies a successful test, and a red X ![]() indicates that there is a problem.
indicates that there is a problem.
To test multiple items at the same time, select the checkbox for each desired item and then click the Test All Selected button.
If there are any failed probes, you can click the blue arrow ![]() to the left of the IP Address field of the failed item to jump to the configuration page to investigate the root cause.
to the left of the IP Address field of the failed item to jump to the configuration page to investigate the root cause.