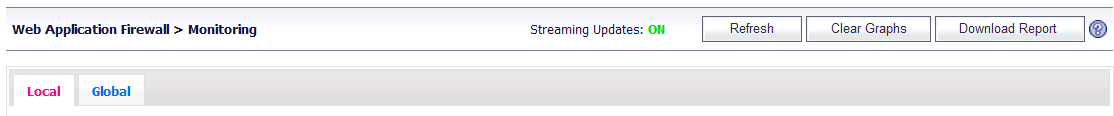
The Web Application Firewall > Monitoring page provides two tabs: Local and Global. The pages for both tabs display statistics and graphs for detected/prevented threats over time and top 10 threats. The Local tab also displays Web server status statistics and graphs of the number of requests and the amount of traffic during the selected monitoring period.
The monitoring functions of each tab are explained in the following sections:
|
1
|
Select the Local tab. The active tab name is displayed in red or pink, while the inactive tab name is blue. The control buttons act on the page that is currently displayed.
|
|
2
|
|
3
|
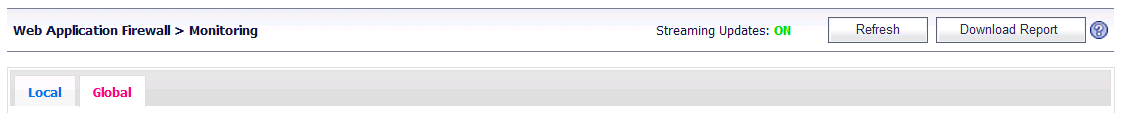
To refresh the display, click the Refresh button.
|
|
4
|
To clear all Web Application Firewall statistics from the graphs and list, click the Clear Graphs button.
|
|
5
|
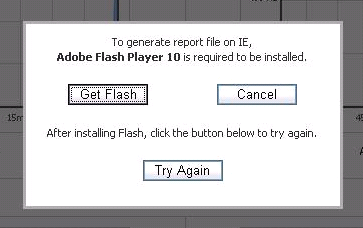
To generate a PDF report containing Web Application Firewall statistics, click the Download Report button.
|
|
6
|
If prompted to install Adobe Flash Player, click Get Flash and then after the installation click Try Again to generate the PDF report from Internet Explorer.
|
On the Local tab, below the control buttons, this page displays graphs for Web server status. One graph shows the number of Web requests detected over time, and another graph shows the amount of traffic in kilobytes (KB).
You can view Web server activity on the Local tab over different time periods by selecting one of the following options from the Monitoring Period drop-down list:
Figure 50 shows a 24 hour period of Web server activity.
Figure 50. Web Server Status For Last 24 Hours
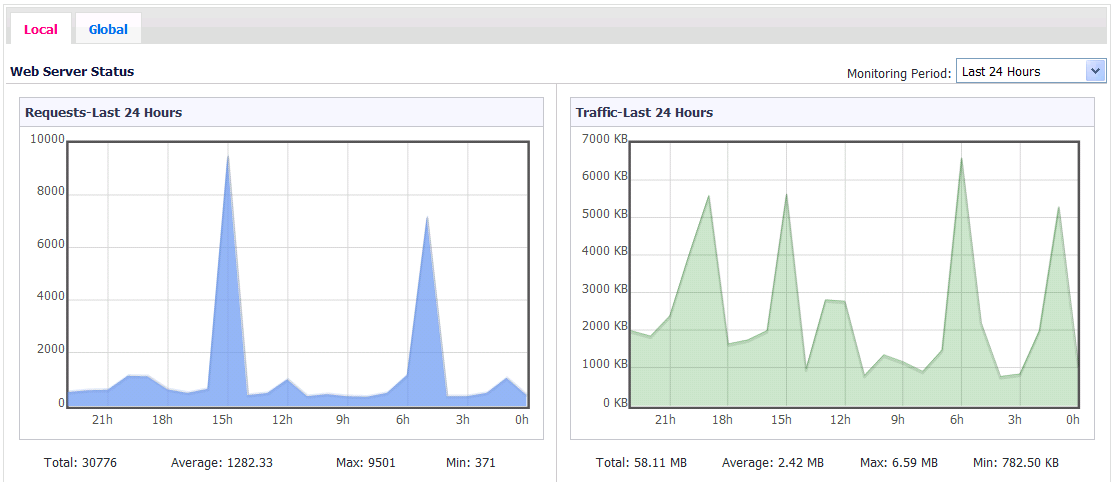
Figure 51 shows a 60 minute period of Web server activity.
Figure 51. Web Server Status For Last 60 Minutes

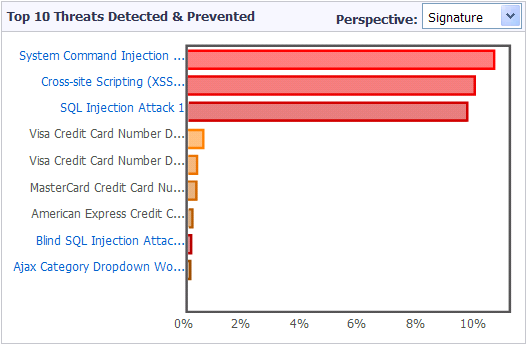
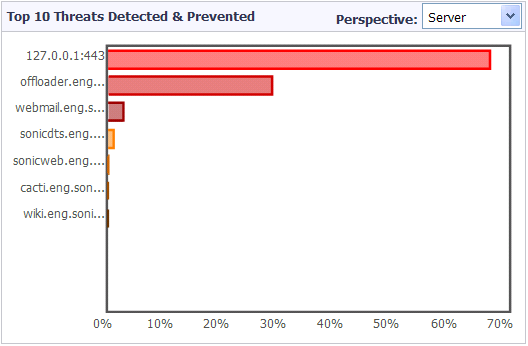
On the Local tab below the Web server status graphs, the Web Application Firewall > Monitoring page displays graphs indicating the number of detected and prevented threats. Two graphs are presented, one showing the number of threats over time, and the other showing the top ten threats that were detected and prevented during that time frame.
You can change the time frame displayed in both graphs or change the view to display all threats in list format by selecting one of the following options from the Monitoring Period drop-down list:
Figure 52 shows the number and severities of threats detected and prevented over the last 21 days.
Figure 52. Threats Over Last 21 Days

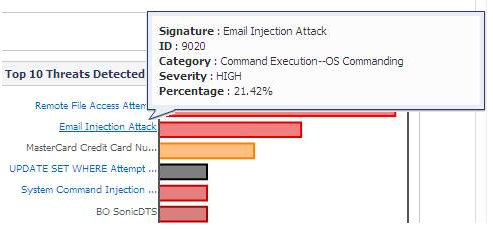
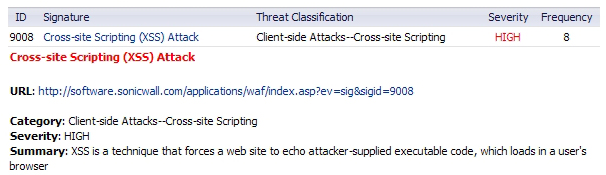
When displaying the top 10 threats graph with Perspective set to Signature, hovering your mouse pointer over the signature ID causes a tooltip to appear with details about the threat.
Figure 53. Threat Details Tooltip
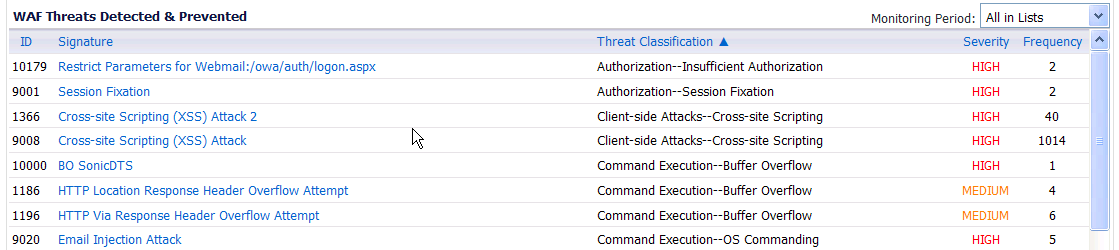
To see the threats in list format rather than as a graph, select All in Lists from the Monitoring Period drop-down list. Figure 54 shows the list format.
The Severity column of the threat list is color coded for quick reference, as follows:
|
•
|
|
•
|
Medium severity threats – Orange
|
Figure 54. Threats in List Format
|
1
|
On the Web Application Firewall > Monitoring page, select All in Lists from the Monitoring Period drop-down list. The list of detected or prevented threats is displayed in the WAF Threats Detected & Prevented table.
|
|
•
|
URL – The URL to the Dell SonicWALL knowledge base for this threat
|
|
•
|
Category – The category of the threat
|
|
•
|
Severity – The severity of the threat, either high, medium, or low
|
|
•
|
Summary – A short description of how the threat behaves
|
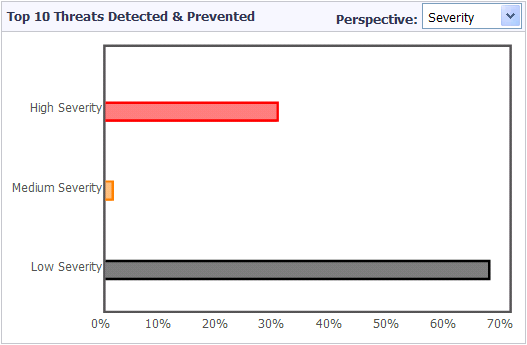
For the Top 10 Threats graph, you can select the following display options from the Perspective drop-down list:
The Global tab displays statistics and graphs for threats reported by all SRA appliances with Web Application Firewall enabled. Graphs are displayed for WAF Threats Detected & Prevented.
|
1
|
Select the Global tab. The active tab name is displayed in red or pink, while the inactive tab name is blue. The control buttons act on the page that is currently displayed.
|
|
2
|
|
3
|
To refresh the display, click the Refresh button.
|
|
4
|
To generate a PDF report containing Web Application Firewall statistics, click the Download Report button.
|
|
5
|
If prompted to install Adobe Flash Player, click Get Flash and then after the installation click Try Again to generate the PDF report from Internet Explorer.
|
At the top of the Global tab, the Web Application Firewall > Monitoring page displays graphs indicating the number of detected and prevented threats. Two graphs are presented, one showing the number of threats over time, and the other showing the top ten threats that were detected and prevented during that time frame.
You can change the time frame displayed in both graphs by selecting one of the following options from the Monitoring Period drop-down list:
Figure 55 shows the number and severities of threats detected and prevented over the last 21 days.
Figure 55. Threats Over Last 21 Days

Figure 56. Threat Details Tooltip