Dashboard_BWM_Monitor
Dashboard > BWM Monitor
The Dashboard > BWM Monitor page provides bandwidth monitors for both Global BWM and Advanced BWM. To switch between Global and Advanced BWM, navigate to the Firewall Settings > BWM screen and select the desired Bandwidth Management Type.
Global Bandwidth Monitor
In Global BWM mode, the BWM Monitor displays eight different monitors. Each monitor shows the bandwidth usage for each priority, and has a separate graph for ingress and egress traffic. The following priorities are displayed in the BWM monitor in Global BWM mode:
• Real-time
• Highest
• High
• Medium High
• Medium
• Medium Low
• Low
• Lowest
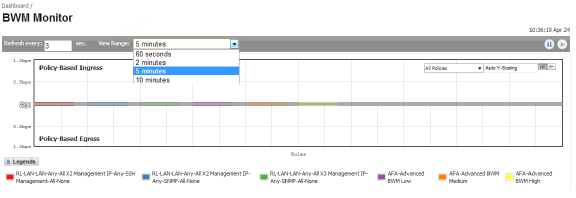
The View Range list lets you select the following intervals:
• 60 seconds
• 2 minutes
• 5 minutes
• 10 minutes (default)
The Refresh Every box is configurable from 3 to 30 seconds.
The bandwidth management priority is depicted by current, dropped, guaranteed, and maximum.
The following graphic shows the BWM monitor in Global Bandwidth Mode:

Advanced Bandwidth Monitor
In Advanced BWM mode, the Dashboard > BWM Monitor provides two monitors that enable administrators to monitor bandwidth usage:
• Policy-Based Ingress/Egress monitor
• Policy-Based Top10 monitor
These monitors display graphs of bandwidth usage based on the configured Advanced Bandwidth Management policies, such as Access Rules, App Rules, and Action Objects.
To allow a bandwidth rule to be shown in the BWM Monitor:
1. On the Dell SonicWALL Security Appliance, go to Firewall > Access Rules.
2. Click the Add button.
or
Click the Configure button for the rule you want to configure.
3. Click the BWM tab.
4. Select the Enable Tracking Bandwidth Usage option.
5. Click the OK button.
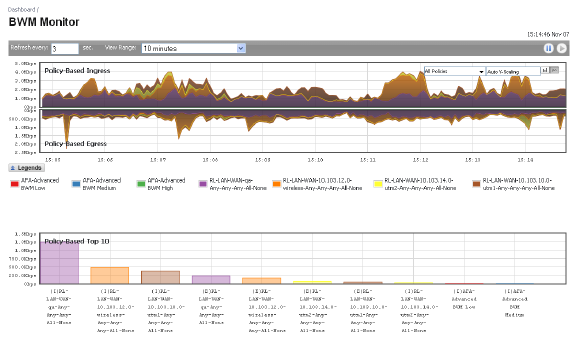
Policy-Based Ingress/Egress
The Policy-based Ingress/Egress graph can display a real-time bandwidth image or a history image. The interval range can be changed by selecting a value for the View Range list.
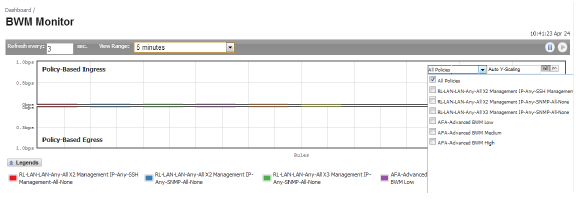
The drop-down list at the top right of this graph lists the policies that the graph can display. The names of policies are preceded with a prefix:
• Access Rules are prefixed by RL.
• Action Objects are prefixed AFA.
Pausing the mouse over certain items displays tooltip information.
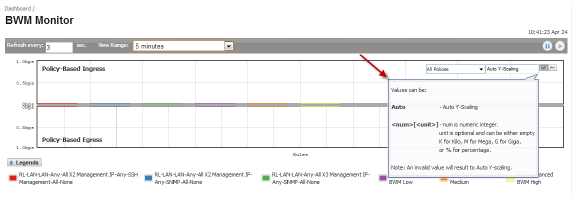
The Auto Y-Scaling, Bar Graph, and Flow Chart options are as follows:
|
Scale
|
|
Allows for Auto Y-Scaling or customized scaling of the Application Flow Chart.
The values for customized scaling must be a numeric integer. Specifying a unit is optional. If a unit is desired, these are the available options:
K for Kilo.
M for Mega.
G for Giga.
% for percentage.
If a custom scale of 100Kbps is desired, then “100K” should be entered. The numeric integer 100 is entered followed by the unit K.
|
|
Bar Graph Format
|

|
Displays the monitor data in a bar graph format.
|
|
Flow Chart Format
|

|
Displays the monitor data in a flow chart format.
|
|
Policy-Based Top 10
The Policy-Based Top 10 monitor displays the most used bandwidth rules. The direction of rules (Ingress/Egress) is significant. (I) before the name of a rule indicates that it is an Ingress rule. (E) before the name of a rule indicates that it is an Egress rule.

The values used for sorting the Top 10 rules is the average bandwidth accumulated from historic traffic. It is not the bandwidth of the current calculation time interval. Hence, you may see different values for the same rule between the Top 10 graph and other real-time monitors.
To get the precise value of the average bandwidth of a specific rule:
• Pause your mouse over the bar for that rule.
To see a pie chart of the per-IP bandwidth for a specific rule:
• Double click the bar for that rule.

The IP address and the percentage of bandwidth consumed is displayed in the per-IP bandwidth pie chart. The percentage of bandwidth consumed is calculated from the average bandwidth usage and not real-time values.
Note The pie chart of the per-IP bandwidth is displayed only if that rule is configured for per-IP bandwidth management in the Elemental Bandwidth Settings dialog.