The Log Monitor table provides numerous settings to allow you to navigate, view, and export results. Table columns can be customized, so that you can view full data on any event or only the data you need. Table entries can be sorted to display in either ascending or descending order. For information about sorting and navigating the Log Monitor display, see Manipulating Tables .
The top row of the Log Monitor table contains several functional fields and icons:
![]()
For the Filter field, see Filtering the Log Monitor Table . For the other elements, see:

From the Display drop-down menu, you can select the time interval in which to view log events. Time intervals range from the last 60 seconds to the last 30 days, or all log events (All Entries) in the database. The default is Last 5 minutes.
![]()
The functional icons above the display allow you to perform various functions:
|
NOTE: Clicking the:
|
|
•
|
Emailing the log in an email by clicking the Email icon. Using your email client, you can set up:
|
For more information about configuring email log automation, see Email Log Automation .
|
•
|
Configuring the data to display by clicking the Configure icon; see Configuring Log Data to Display .
|
|
•
|
Clearing all logs by clicking the Clear Statistics icon. This action deletes entries from the run-time event log database permanently, so it is recommended that, if automation is not enabled, you export the database before clicking the icon.
|
|
•
|
Configuring logging by clicking the Link icon to display the Log > Log Settings page. For information about configuring logging, see Configuring Log Settings .
|
Pausing your cursor over an icon reveals the function of the icon. For a description of the common icons, see Common Icons
![]()
There are two ways to refresh the display:
|
•
|
To refresh all output immediately, click the Refresh icon.
|
|
•
|
To specify how often the Log Monitor table is updated automatically with events from the event log database, enter a time in the Refresh ___ sec. field. The minimum time is 10 seconds, the maximum time is 999 seconds, and the default is every 60 seconds.
|
You can pause the Log Monitor table from updating its content. If the Log Monitor table is very busy and is being updated continually, pausing the updating allows you to inspect the messages.
To pause the display, click the Pause icon at the top right corner of the display. The icon turns into the Play icon. To resume updating, click the Play icon, which now becomes the Pause icon. When updating is resumed, the display is refreshed.
|
1
|
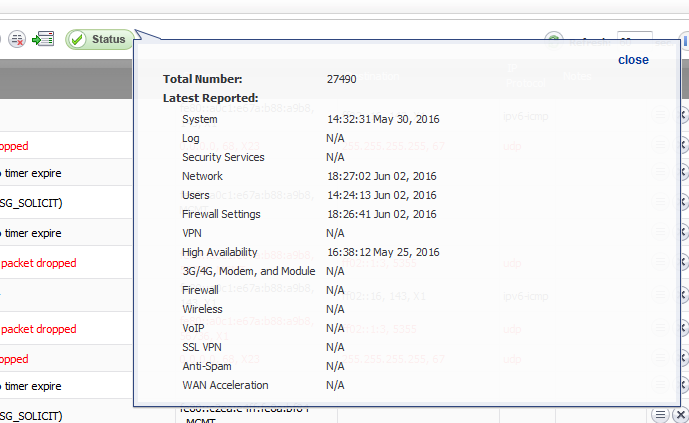
Mouse over or click the Status icon. A brief summary of information about the categories of messages displays:
|
|
2
|
To close the dialog, click close.
|
|
•
|
|
•
|
Table 21 lists the columns that are displayed by default. You can select the columns you want to display and deselect the ones that you do not want to display. By selecting only columns meaningful to you, the Log Analyzer gives a more clean, concise, and meaningful way to view the logs, instead of displaying unnecessary columns that take up valuable real estate.
|
1
|
|
2
|

|
3
|
Select the columns you want to display and deselect those you do not want. Table 21 lists the default columns.
|
|
Category from the Log > Settings page. |
||
|
Displays the source IP address, the source port, and the source network and IP address |
||
|
4
|
Click Apply. The Log Monitor display is updated immediately to reflect the changes.
|
You can always erase the changes you made to the display by reverting to the default display (see Table 21).
|
1
|
Go to Dashboard > Log Monitor.
|
|
2
|
Click the Configure icon.
|
|
3
|
Click the Restore Default button.
|
|
4
|
Click Apply.
|