|
1
|
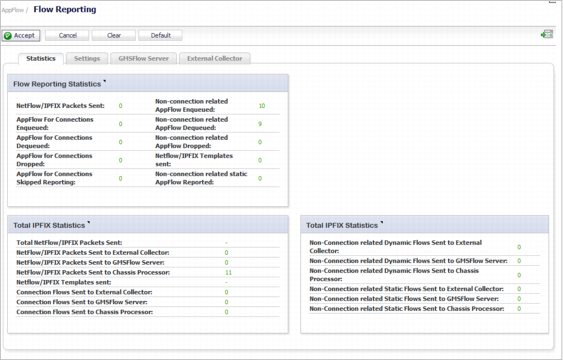
Navigate to the AppFlow > Flow Reporting page.
|
|
2
|
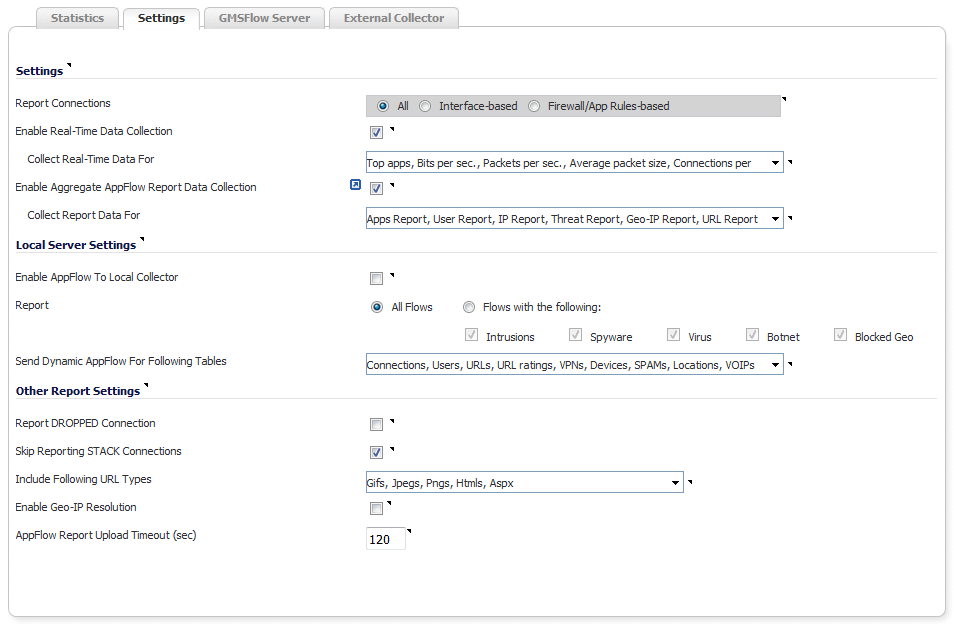
Click the Settings tab.
|
|
3
|
Select the Enable Real-Time Data Collection checkbox. This checkbox is selected by default.
|
|
4
|
Select from the Collect Real-Time Data For drop-down menu the reports you would like to see captured (all are selected by default):
|
|
•
|
|
5
|
To enable AppFlow reporting to an internal collector, in the Local Server Settings section, select the Enable AppFlow To Local Collector checkbox. This option is not selected by default.
|
|
•
|
All Flows (default)
|
|
•
|
Flows with the following: – Limit the number of flows collected by selecting one or more of the following:
|
|
•
|
|
•
|
|
•
|
|
7
|
From the Send Dynamic AppFlow For Following Tables drop-down menu, select the reports for monitoring (by default, all are selected):
|
|
•
|
|
•
|
|
•
|
|
•
|
|
•
|
|
•
|
|
NOTE: For information about configuring other options on the Appflow > Flow Reporting page, see Managing Flow Reporting Statistics .
|
|
8
|
To enable these reports, click the Accept button to save your changes.
|
|
9
|
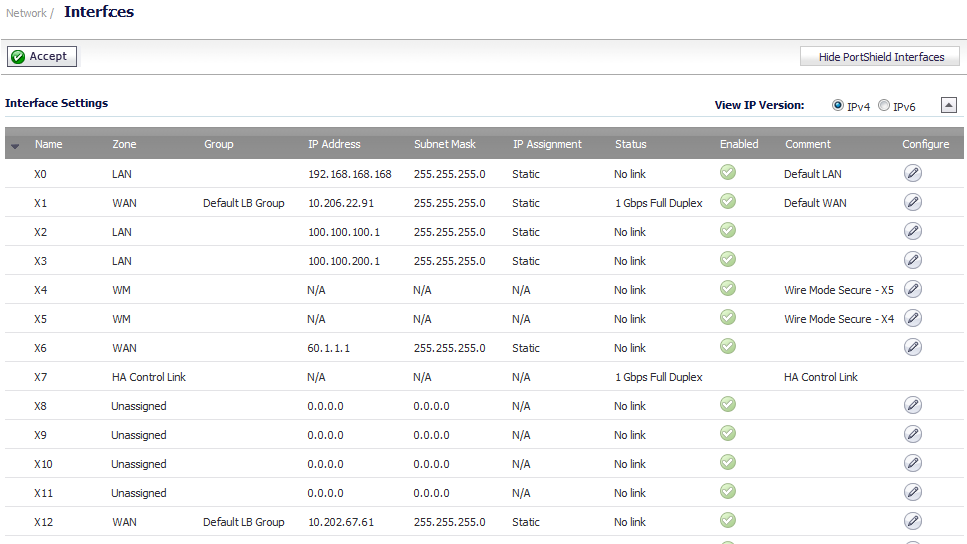
Navigate to the Network > Interfaces page.
|
|
10
|
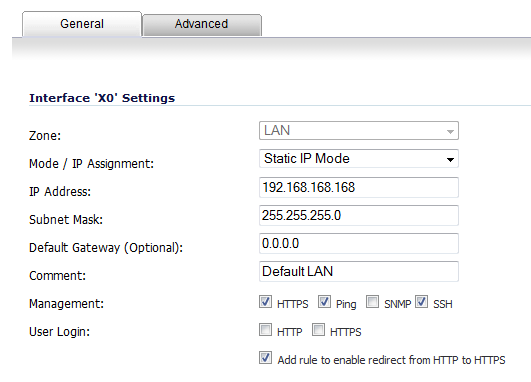
Click the Configure icon for the interface on which you wish to enable flow reporting. The Edit Interface dialog displays.
|
|
11
|
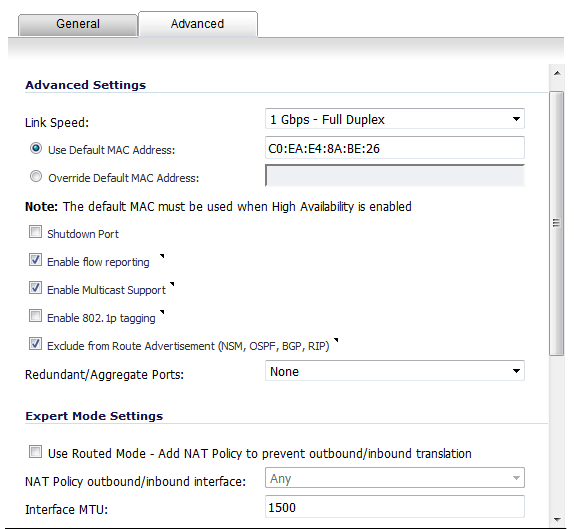
Click the Advanced tab.
|
|
12
|
|
13
|
Click the OK button to save your changes.
|
For more detailed information on configuring Flow Reporting settings, refer to Dashboard > AppFlow Reports .