CDP_Reports
Configuring and Understanding Reports
Agent Summary Reports
The Agent Summary Reports displays a bar graph and data table containing details about Agent quotas, disk usage, and file counts based on individual Agents.
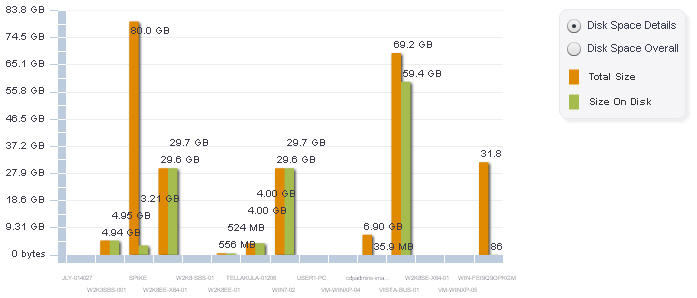
The Agent Summary graph allows administrators to compare disk usage among Agents. The legend located to the right of the graph defines the colors seen in the graph. Located above the legend are viewing options. The Disk Space Details and Disk Space Overall are two viewing options available to display the Agent Summary details.

Changing Graph Views
Changing the graph views allows for viewing of individual agents’ disk space usage and overall disk space usage.

|
|
Select a viewing option. Two options are available: Disk Space Details or Disk Space Overall . The graph updates automatically when a radio button is selected. |
Disk Space Details
The Disk Space Details displays details about Disk Space usage and availability, based on individual Agents. The graph contains a x-axis indicating the Agent Name, y-axis indicating the amount of disk space in gigabytes (GB), a legend defining the colors seen in the graph, and viewing options located above the legend.
Disk Space Overall
The Disk Space Overall graph displays details about overall disk space on the appliance. The graph provides the administrator a visual representation of used and free disk space. The orange color represents the allotted quota size whereas the green color represents the amount of disk space used.


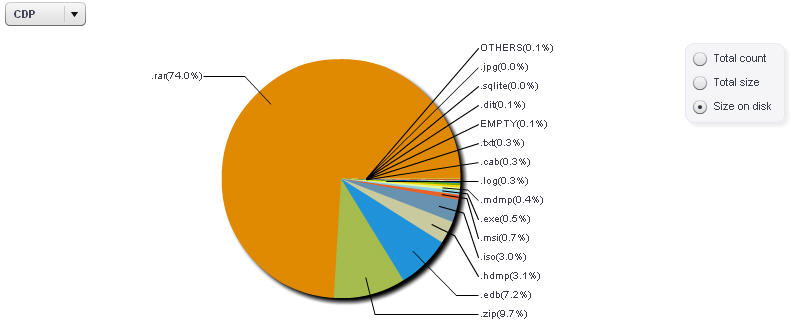
Disk Space by File Type Reports
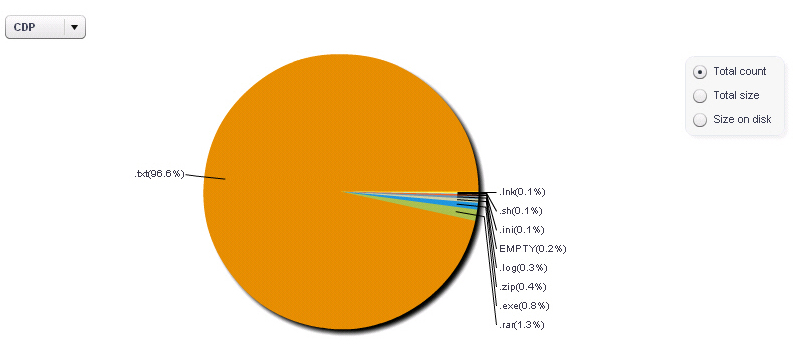
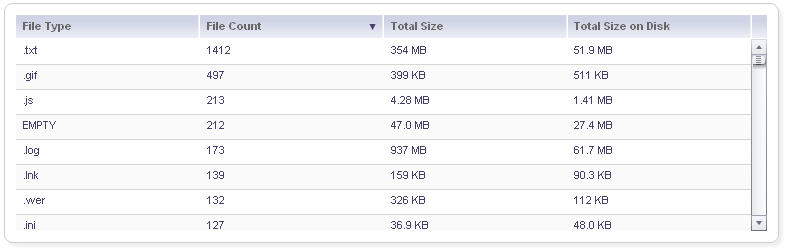
The Disk Space by File Type Reports displays details about the total amount of disk space used categorized by different file types. The report is comprised of a pie chart, viewing options, and data table. Each file type is labeled and represented by a color in the pie chart.
Disk Space by File Type Chart
Changing the chart views allows for viewing of the total count, size, and size on disk of disk space organized by file type. The Total Count, Total Size, and Size on Disk are the three available viewing options.
Changing Graph Views
Alternate viewing options are available to help the administrator visualize the collected information.
|
|
Determine the desired view: the CDP disk space or Fileset disk space by file type. Select one of the two options available in the drop-down menu located to the upper-left of the pie chart. |

|
|
Locate the three radio buttons to the right of the pie chart and make a selection. Three options are available: Total Count , Total Size , and Size on Disk . |

The data table changes accordingly to the graph view you select.
Total Count View
The Total Count View provides a visual representation of the total files allocated to the disk space of the appliance.

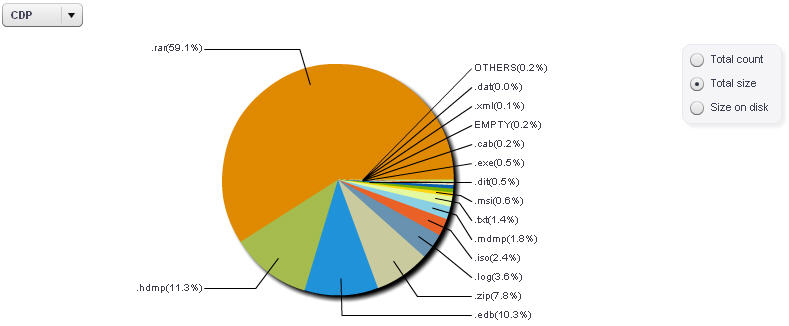
Total Size View
The Total Size View provides a visual representation of the size of all the files being backed up.
Size on Disk View
The Size on Disk View provides a visual representation of the total of all files on the disk.
|
Displays the number of file types located on the appliance disk space. |
|
|
Displays the total of all file sizes located on the appliance disk space. |
Disk Space Summary Reports
The Disk Space Summary Reports display details about the amount of total disk space used by individual Agents.
Graph
Changing the chart views allows for viewing of the total count, size, and size on disk of disk space organized by file type.
Detailed Event List Reports
The Detailed Event List Report displays details about individual backup events including the filepath, file name, timestamp, size, and size on disk.
Detailed Event Display Options
Changing the graph views allows for viewing of individual agents’ disk space usage and overall disk space usage.
|
|
Select a viewing option. Two options are available: Disk Space Details or Disk Space Overall . The graph view changes automatically when a radio button is selected. |
Agent Events Summary Reports
The Agent Events Summary Report displays details about backup file count and backup file size information pertaining to individual agents.
Graph
Changing the chart views allows for viewing of the total count, size, and size on disk of disk space organized by file type.
Daily Events Summary Reports
The Daily Events Summary Reports displays details a daily summary of events that occurred on a specific date.
Graph
Changing the chart views allows for viewing of the total count, size, and size on disk of disk space organized by file type.
Schedule Backup Reports
The Schedule Backup Reports displays a visual summary about scheduled backups that occurred today and within the past 2 days, 7 days, 14 days, and 30 days.
Graph
Changing the chart views allows for viewing of the total count, size, and size on disk of disk space organized by file type.
Configuring Scheduled Reports Delivered by Email
Administrators can configure SonicWALL CDP to deliver scheduled reports by email.
|
Enables the delivery of scheduled reports to the administrators email. |
|
|
Allows the administrator to determine the amount of information displayed in the activity report. |