
|
•
|
|
•
|
The Maximum requests to send at a time setting is available on the Advanced tab of the SSO agent configuration.
This setting controls the maximum number of requests that can be sent from the appliance to the agent at the same time. The agent processes multiple requests concurrently, spawning a separate thread in the PC to handle each. Sending too many requests at a time can overload the PC on which the agent is running. If the number of requests to send exceeds the maximum, then some are placed on an internal “ring buffer” queue (see Using the Single Sign-On Statistics in the TSR and Viewing SSO Mouseover Statistics and Tooltips). Requests waiting on the ring buffer for too long could lead to slow response times in SSO authentication.
To view the statistics for a particular agent, hover your mouse pointer over the Statistics icon to the right of the SSO agent. This also works for individual TSAs on the Terminal Services tab.
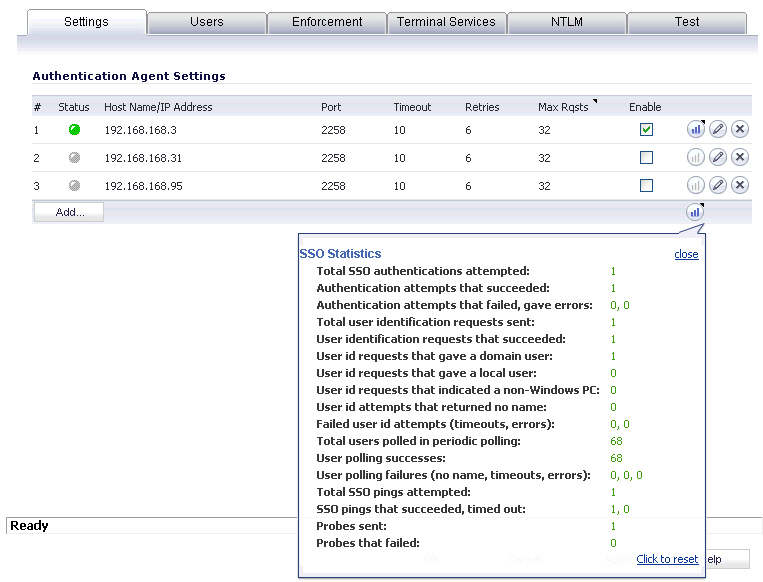
To close the statistics display, click close.
To clear all the displayed values, click Click to reset.
A rich set of SSO performance and error statistics is included in the trouble shooting report (TSR). These can be used to gauge how well SSO is performing in your installation. Download the TSR on the System > Diagnostics page and search for the title “SSO operation statistics”. The following are the counters to look at in particular:
|
1
|
Under Users currently connected, the TSR can include a list of all currently logged in local and remote users, regardless of how they were authenticated. On the System > Diagnostics page before generating the TSR, select Current Users and do one of the following:
|
|
•
|
Select Detail of Users, which displays eight to nine lines of detailed information in the TSR for each user.
|
When Detail of Users is selected, numerous details are provided, varying with the type of user. They include timers, privileges, management mode if managing, group memberships, CFS policies, VPN client networks, and other information. Disabling this option when there are thousands of users logged in could greatly decrease the size of the TSR file that is created, versus one that includes the detailed users list.
|
•
|
Clear (deselect) Detail of Users, which displays just one summary line per user. If the Current Users check box is not selected, then the users list is omitted from the TSR.
|
When Detail of Users is not selected, the user summary includes the IP address, user name, type of user and, for administrative users who are currently managing, their management mode. For example:
192.168.168.1: Web user admin logged in (managing in Config mode)
192.168.168.9: Auto user Administrator (SD80\Administrator) auto logged in
|
2
|
Under SSO ring buffer statistics, look at Ring buffer overflows and Maximum time spent on ring. If the latter approaches or exceeds the polling rate, or if any ring buffer overflows are shown, then requests are not being sent to the agent quickly enough. Also, if the Current requests waiting on ring is constantly increasing, that would indicate the same. This means that the Maximum requests to send at a time value should be increased to send requests faster. However, that will increase the load on the agent, and if the agent cannot handle the additional load, then problems will result, in which case it may be necessary to consider moving the agent to a more powerful PC or adding additional agents.
|
|
3
|
Under SSO operation statistics, look at Failed user id attempts with time outs and Failed user id attempts with other errors. These should be zero or close to it – significant failures shown here indicate a problem with the agent, possibly because it cannot keep up with the number of user authentications being attempted.
|
|
4
|
Also under SSO operation statistics, look at the Total users polled in periodic polling, User polling failures with time outs, and User polling failures with other errors. Seeing some timeouts and errors here is acceptable and probably to be expected, and occasional polling failures will not cause problems. However, the error rate should be low (an error rate of about 0.1% or less should be acceptable). Again, a high failure rate here would indicate a problem with the agent, as above.
|
|
5
|
Under SSO agent statistics, look at the Avg user ID request time and Avg poll per-user resp time. These should be in the region of a few seconds or less – something longer indicates possible problems on the network. Note, however, that errors caused by attempting to authenticate traffic from non-Windows PCs via SSO (which can take a significantly long time) can skew the Avg user ID request time value, so if this is high but Avg poll per-user resp time looks correct, that would indicate the agent is probably experiencing large numbers of errors, likely due to attempting to authenticate non-Windows devices.
|
|
6
|
If using multiple agents, then also under SSO agent statistics look at the error and timeout rates reported for the different agents, and also their response times. Significant differences between agents could indicate a problem specific to one agent that could be addressed by upgrading or changing settings for that agent in particular.
|
|
•
|
If using Content Filtering, select that address object with the Bypass the Single Sign On process for traffic from setting on the Enforcement tab of the SSO configuration.
|
|
•
|
For related information, see the White Listing IP Addresses to Bypass SSO and Authentication.
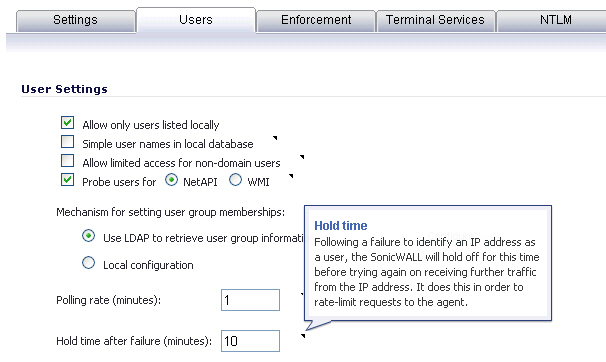
To identify the IP addresses concerned, look in the TSR and search for “IP addresses held from SSO attempts”. This lists SSO failures in the preceding period set by the Hold time after failure setting.
To limit the rate of errors due to this, you can also extend the Hold time after failure setting on the Users tab.
For information about viewing SSO statistics on the SSO configuration page, see Viewing SSO Mouseover Statistics and Tooltips.
If the above statistics indicate a possible problem with the agent, a good next step would be to run Windows Task Manager on the PC on which the agent is running and look at the CPU usage on the Performance tab, plus the CPU usage by the CIAService.exe process on the Processes tab. If the latter is using a large percentage of the CPU time and the CPU usage is spiking close to 100%, this is an indication that the agent is getting overloaded. To try to reduce the loading you can decrease the Maximum requests to send at a time setting; see Using the Single Sign-On Statistics in the TSR.
|
•
|
Consider reducing the polling rate configured on the Users tab by increasing the poll time. This will reduce the load on the agent, at the cost of detecting logouts less quickly. Note that in an environment with shared PCs, it is probably best to keep the poll interval as short as possible to avoid problems that could result from not detecting logouts when different users use the same PC, such as the initial traffic from the second user of a PC possibly being logged as sent by the previous user.
|