|
NOTE: For increased convenience and accessibility, the Log Monitor page can be accessed either from Dashboard > Log Monitor or Log > Log Monitor. The two pages provide identical functionality.
|
The event log can be sent automatically to an Email address for convenience and archiving. Alerts from the Log Monitor can also be sent via Email and can alert you about such things as attacks to your firewall. Alerts are immediately e-mailed, either to an e-mail address or to an e-mail pager. Each log entry contains the date and time of the event and a brief message describing the event.
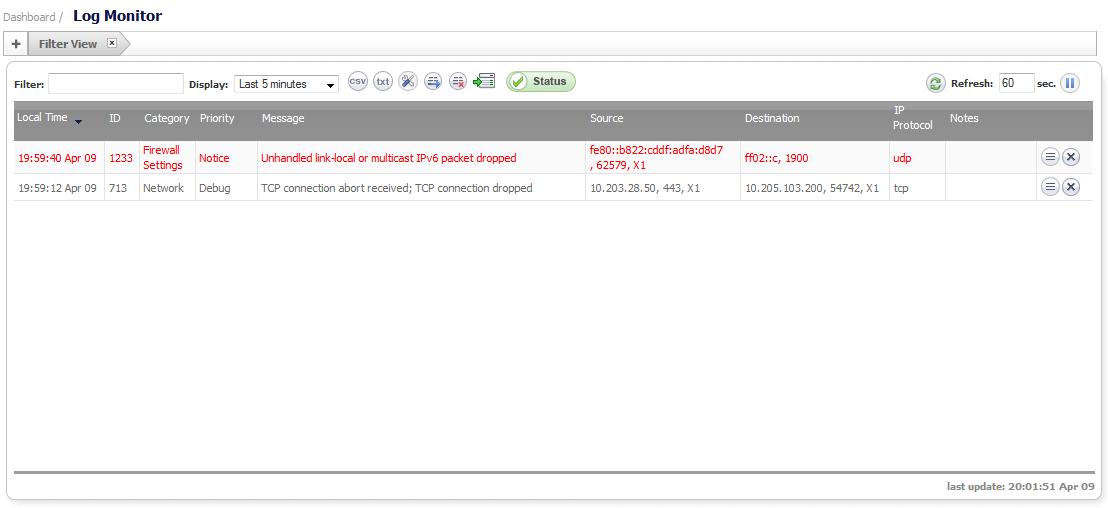
The displayed information is controlled by setting options for which categories you want to display in the log table. Use the Categories column to determine the baseline events to monitor and to configure event-specific information.
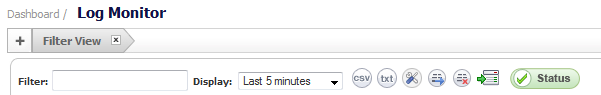
You can type any substring and press the Enter key to filter the Log Monitor table. The Log Monitor lists only log events that contain matches for that substring.
|
•
|
Online Viewing of Log Events—The Event Log is not persistent. Older events in the run-time Event Log database buffer may be over-written with newer events.
|
|
•
|
Online Viewing Using the SonicOS Log Monitor UI—The UI takes snapshots of the Event Log database, so users can scroll forward and backwards in the Event Log using their browser.
|
|
•
|
Text Viewing Format Using the CLI—Shows only the current content of the Event Log database.
|
|
•
|
Log Monitor Display Filtering—You can customize the Log Event display.
|
|
•
|
Log Settings Capture Filtering—You can customize the Log Event capture.
|
|
•
|
Offline Viewing of Log Events—Offline viewing is persistent because the system saves the log events to an external source, such as your computer.
|
|
•
|
Viewing Log Events via Email—Using your Email client, you can setup individual Email alerts that are sent whenever an event occurs, or an Email digest that sends batches of log events periodically.
|
|
•
|
Viewing Log Events via Syslog Viewer—You can view and configure log events and capture settings using a Syslog viewer.
|
|
•
|
Viewing Log Events via GMS Syslogs—You can view and configure log events using GMS.
|
|
•
|
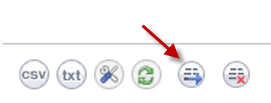
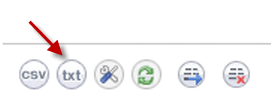
Exporting the Event Log Database—You can export the Event Log database as a plain text file by clicking the Export button.
|
|
•
|
Deleting Entries from the Run-Time Event Log Database—You can permanently delete entries, using the Clear All button. So, proceed with caution. If automation is not enabled, export the database before using Clear All.
|
|
•
|
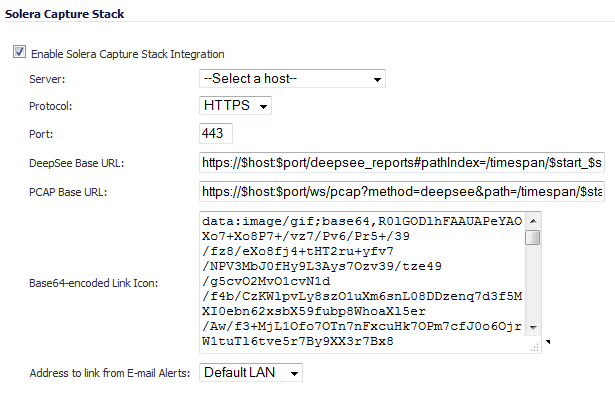
Deep Packet Forensics using a Data Recorder such as Solera—You can record deep packet events using a data recorder such as Solera. This feature is enabled under Log > Automation, and the events to record are configured under Log > Settings.
|