The Settings tab has configurable options for local internal flow reporting, AppFlow Server external flow reporting, and the IPFIX collector.
|
•
|
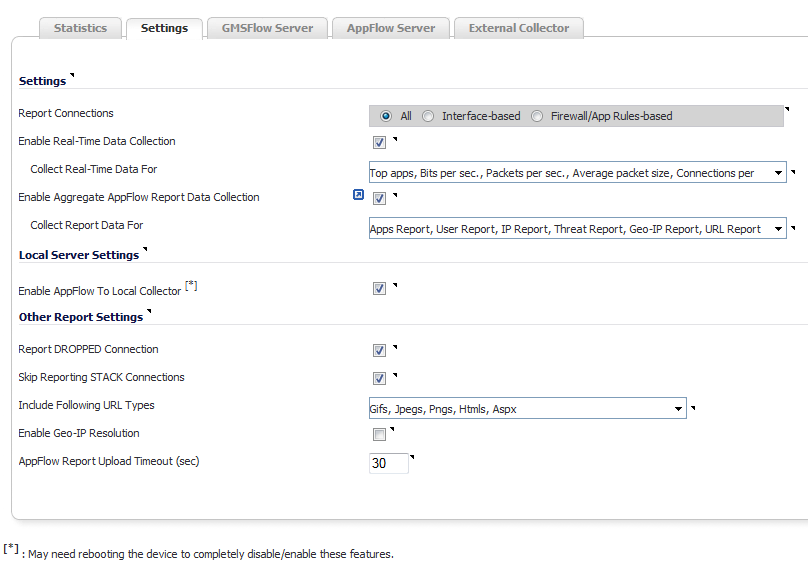
The Settings section of the Settings tab allows you to enable real-time data collection and AppFlow report collection.
|
•
|
Report Collections—Enables AppFlow reporting collection according to one of these modes:
|
|
•
|
All — Selecting this radio button reports all flows. This option is selected by default.
|
|
•
|
Interface-based — Selecting this radio button enables flow reporting based only on the initiator or responder interface. This provides a way to control what flows are reported externally or internally. If enabled, the flows are verified against the per interface flow reporting configuration, located in the Network > Interface page. If an interface has its flow reporting disabled, then flows associated with that interface are skipped.
|
|
•
|
Firewall/App Rules-based — Selecting this radio button enables flow reporting based on already existing firewall Access and App rules configuration, located on the Firewall > Access Rules page and the Firewall > App Rules page, respectively. This is similar to interface-based reporting; the only difference is instead of checking per interface settings, the per firewall rule is selected.
|
|
•
|
Enable Real-Time Data Collection—This setting enables real-time data collection on your Dell SonicWALL appliance for real-time statistics. Individual items can be enabled/disabled in the Collect Real-Time Data For drop-down menu. This setting is enabled by default.
|
When this setting is disabled, the Real-Time Monitor does not collect or display streaming data as the real-time graphs displayed in the Dashboard > Real-Time Monitor page are disabled.
|
•
|
Collect Real-Time Data For—Select from this drop-down menu the streaming graphs to display on the Dashboard > Real-Time Monitor page:
|
|
•
|
Top Apps—Displays the Applications graph.
|
|
•
|
Bits per sec.—Displays the Bandwidth graph.
|
|
•
|
Packets per sec.—Displays the Packet Rate graph.
|
|
•
|
Average packet size—Displays the Packet Size graph.
|
|
•
|
|
•
|
Core utility—Displays the Multi-Core Monitor graph.
|
|
•
|
Enable Aggregate AppFlow Report Data Collection—When enabled, the firewall will start collecting data for an aggregate report. Individual reports can be enabled/disabled in the Collect Report Data For drop-down menu. This setting is enabled by default.
|
|
TIP: By clicking the Show AppFlow Monitor
|
|
•
|
Collect Real-Time Data For—Select from this drop-down menu the streaming graphs to display on the Real-Time Monitor page. By default, all reports are selected.
|
The Local Server Settings section allows you to enable AppFlow reporting to an internal collector.
|
•
|
Send AppFlow To Local Collector—This setting enables AppFlow reporting collection to an internal server on your Dell SonicWALL appliance. If this option is disabled, the tabbed displays on Dashboard > AppFlow Monitor are disabled. By default, this option is enabled.
|
The options in the Other Report Settings section configure conditions under which a connection is reported. This section does not apply to all non-connection-related flows.
|
•
|
Report DROPPED Connection—If enabled, connections that are dropped due to firewall/app rules are not reported. This option is enabled by default.
|
|
•
|
Skip Reporting STACK Connections—If enabled, the firewall will not report all connections initiated or responded to by the firewall’s TCP/IP stack. By default, this option is enabled.
|
|
•
|
Include Following URL Types—From the drop-down menu, select the type of URLs that need to be reported. To skip a particular type of URL reporting, uncheck (disable) the URL. Only the following types are enabled by default: Gifs, Jpegs, Pngs, Htmls, and Aspx.
|
|
•
|
Enable Geo-IP Resolution—Enables Geo-IP resolution. If disabled, the AppFlow Monitor will not group flows based on country under initiator and responder tabs. This setting is unchecked (disabled) by default.
|
|
•
|
AppFlow Report Upload Timeout (sec)—Specify the timeout, in seconds, when connecting to the AppFlow upload server. The minimum timeout is 5 seconds, the maximum is 120 seconds, and the default value is 30 seconds.
|