Configuration
The section describes how to plumb a port for incoming IPFix data.
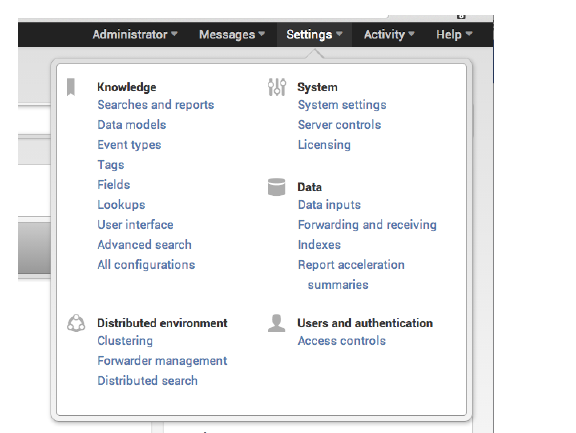
1. Select Settings > Data > Data inputs.
Note If dell_ipfix is already listed, you can skip the following step.
2. Locate the item listed as the "Dell IPFix collector" as shown in the following image.

If you cannot see the item, restart Splunk to be certain it recognizes the recently installed app.
3. Next to “Dell IPFix collector,” select Add New link.
4. Fill in the following values:
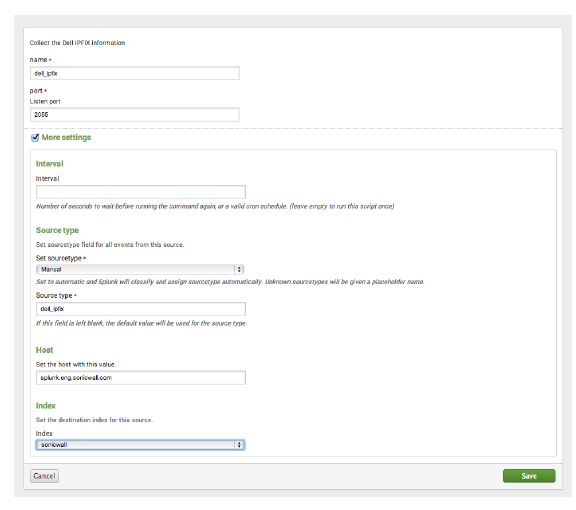
5. Click Save.
Note If you enter the “Source type” incorrectly, the application will not function correctly.
Troubleshooting
Make Sure the Port is Open
netstat -an | grep 2055
That should return:
[root@splunk ~]# netstat -an | grep 2055
udp 0 0 0.0.0.0:2055
0.0.0.0:*
Verify Inbound IPFix Traffic
If you have already configured a firewall to send data, run this command to verify you are receiving the data.
sudo tcpdump port 2055
Your firewall is configured correctly if you can see any traffic.
[root@splunk2 ~]# tcpdump -i em4 -c 10 port 2055
tcpdump: verbose output suppressed, use -v or -vv for full protocol decode
listening on em4, link-type EN10MB (Ethernet), capture size 65535 bytes
16:29:20.811858 IP 10.197.6.254.iop > 10.204.40.20.iop: UDP, length 500
16:29:20.811917 IP 10.197.6.254.iop > 10.204.40.20.iop: UDP, length 228
16:29:20.873447 IP 10.197.6.254.iop > 10.204.40.20.iop: UDP, length 1180
16:29:20.873631 IP 10.197.6.254.iop > 10.204.40.20.iop: UDP, length 1180
16:29:20.873654 IP 10.197.6.254.iop > 10.204.40.20.iop: UDP, length 252
16:29:20.873911 IP 10.197.6.254.iop > 10.204.40.20.iop: UDP, length 1060
16:29:20.874044 IP 10.197.6.254.iop > 10.204.40.20.iop: UDP, length 332
16:29:20.874074 IP 10.197.6.254.iop > 10.204.40.20.iop: UDP, length 60
16:29:20.874116 IP 10.197.6.254.iop > 10.204.40.20.iop: UDP, length 56
16:29:20.882174 IP 10.197.6.254.iop > 10.204.40.20.iop: UDP, length 440
10 packets captured
10 packets received by filter
0 packets dropped by kernel
If you cannot see any traffic:
1. Test network connectivity by pinging the IP address of the firewall.
a. If the firewall does not respond, enable the ping response to react per interface on the firewall.
2. Ping the Splunk server from the firewall using the diagnostics page. Make sure you have correctly entered the IP address of the firewall in Appflow > Flow Reporting > External Collector.
3. The first time you enable flow reporting, the firewall requires rebooting. Reboot it again just in case.