Log_logReadView
Log > View
The SonicWALL security appliance maintains an Event log for tracking potential security threats. This log can be viewed in the Log > View page, or it can be automatically sent to an e-mail address for convenience and archiving. The log is displayed in a table and can be sorted by column.
The SonicWALL security appliance can alert you of important events, such as an attack to the SonicWALL security appliance. Alerts are immediately e-mailed, either to an e-mail address or to an e-mail pager. Each log entry contains the date and time of the event and a brief message describing the event.
Log View Table
The log is displayed in a table and is sortable by column. The log table columns include:
|
|
|
Time - the date and time of the event. |
|
|
|
Priority
- the level of priority associated with your log event. Syslog uses eight categories to characterize messages – in descending order of severity, the categories include: |
|
|
|
Alert |
|
|
|
Critical |
|
|
|
Error |
|
|
|
Warning |
|
|
|
Notice |
|
|
|
Debug |
Specify a priority level on a SonicWALL security appliance on the Log > Categories page to log messages for that priority level, plus all messages tagged with a higher severity. For example, select ‘error’ as the priority level to log all messages tagged as ‘error,’ as well as any messages tagged with ‘critical,’ ‘alert,’ and ‘emergency.’ Select ‘debug’ to log all messages.
|
|
|
Refer to “ Log Event Messages ” for more information on your specific log event. |
|
|
|
Category - the type of traffic, such as Network Access or Authenticated Access . |
|
|
|
Message - provides description of the event. |
|
|
|
Source - displays source network and IP address. |
|
|
|
Destination - displays the destination network and IP address. |
|
|
|
Notes - provides additional information about the event. |
|
|
|
Rule - notes Network Access Rule affected by event. |
Navigating and Sorting Log View Table Entries
The Log View table provides easy pagination for viewing large numbers of log events. You can navigate these log events by using the navigation control bar located at the top right of the Log View table. Navigation control bar includes four buttons. The far left button displays the first page of the table. The far right button displays the last page. The inside left and right arrow buttons moved the previous or next page respectively.
You can sort the entries in the table by clicking on the column header. The entries are sorted by ascending or descending order. The arrow to the right of the column entry indicates the sorting status. A down arrow means ascending order. An up arrow indicates a descending order.
Refresh
To update log messages, clicking the Refresh button near the top right corner of the page.
Clear Log
To delete the contents of the log, click the Clear Log button near the top right corner of the page.
Export Log
To export the contents of the log to a defined destination, click the Export Log button below the filter table.You can export log content to two formats:
|
|
|
Plain text format --Used in log and alert e-mail. |
|
|
|
Comma-separated value (CSV ) format --Used for importing into Excel or other presentation development applications. |
E-mail Log
If you have configured the SonicWALL security appliance to e-mail log files, clicking E-mail Log near the top right corner of the page sends the current log files to the e-mail address specified in the Log > Automation > E-mail section.
|
|
|
The SonicWALL security appliance can alert you of important events, such as an attack to the SonicWALL security appliance. Alerts are immediately sent via e-mail, either to an e-mail address or to an e-mail pager. For sending alerts, you must enter your e-mail address and server information in the Log > Automation page. |
Filtering Log Records Viewed
You can filter the results to display only event logs matching certain criteria. You can filter by Priority , Category , Source (IP or Interface ), and Destination (IP or Interface ).
|
|
Enter your filter criteria in the Log View Settings table. |
|
|
The fields you enter values into are combined into a search string with a logical AND . For example, if you select an interface for Source and for Destination , the search string will look for connections matching: |
Source interface AND Destination interface
|
|
Check the Group Filters box next to any two or more criteria to combine them with a logical OR . |
For example, if you enter values for Source IP , Destination IP , and Protocol , and check Group Filters next to Source IP and Destination IP , the search string will look for connections matching:
( Source IP OR Destination IP ) AND Protocol
|
|
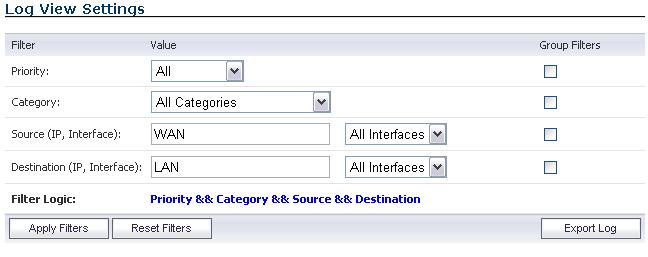
Click Apply Filter to apply the filter immediately to the Log View Settings table. Click Reset Filters to clear the filter and display the unfiltered results again. |
The following example filters for log events resulting from traffic from the WAN to the LAN:
Log Event Messages
For a complete reference guide of log event messages, refer to the SonicOS Log Events Reference Guide .
Deep Packet Forensics
SonicWALL UTM appliances have configurable deep-packet classification capabilities that intersect with forensic and content-management products. While the SonicWALL can reliably detect and prevent any ‘interesting-content’ events, it can only provide a record of the occurrence, but not the actual data of the event.
Of equal importance are diagnostic applications where the interesting-content is traffic that is being unpredictably handled or inexplicably dropped.
Although the SonicWALL can achieve interesting-content using our Enhanced packet capture diagnostic tool, data-recorders are application-specific appliances designed to record all the packets on a network. They are highly optimized for this task, and can record network traffic without dropping a single packet.
While data-recorders are good at recording data, they lack the sort of deep-packet inspection intelligence afforded by IPS/GAV/ASPY/AF. Consider the minimal requirements of effective data analysis:
Together, a UTM device (a SonicWALL appliance) and data-recorder (a Solera Networks appliance) satisfy the requirements to offer outstanding forensic and data-leakage capabilities.
Distributed Event Detection and Replay
The Solera appliance can search its data-repository, while also allowing the administrator to define “interesting-content” events on the SonicWALL. The level of logging detail and frequency of the logging can be configured by the administrator. Nearly all events include Source IP, Source Port, Destination IP, Destination Port, and Time. SonicOS Enhanced has an extensive set of log events, including:
|
|
|
Debug/Informational Events —Connection setup/tear down |
|
|
|
User-events —Administrative access, single sign-on activity, user logins, content filtering details |
|
|
|
Firewall Rule/Policy Events —Access to and from particular IP:Port combinations, also identifiable by time |
|
|
|
Interesting-content at the Network or Application Layer —Port-scans, SYN floods, DPI or AF signature/policy hits |
The following is an example of the process of distributed event detection and replay:
|
|
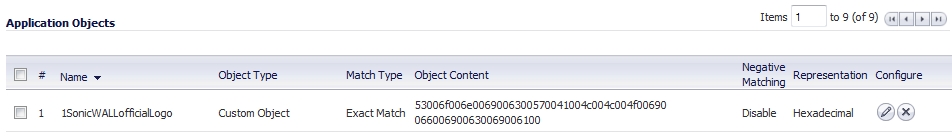
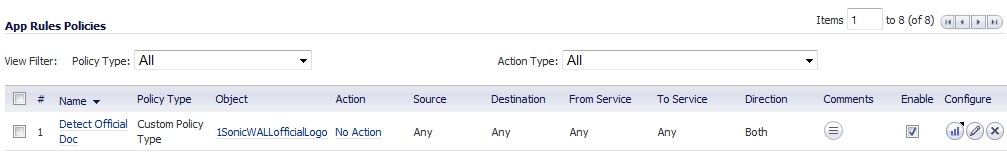
The administrator defines the event trigger. For example, an Application Firewall policy is defined to detect and log the transmission of an official document: |
|
|
The administrator selects the Recorder icon from the left column of the log entry. Icon/link only appears in the logs when a NPCS is defined on the SonicWALL (e.g. IP: [192.168.169.100], Port: [443]). The defined NPCS appliance will be the link’s target. The link will include the query string parameters defining the desired connection. |
|
|
The requested data will be presented to the client as a .cap file, and can be saved or viewed on the local machine. |
Methods of Access
The client and NPCS must be able to reach one another. Usually, this means the client and the NPCS will be in the same physical location, both connected to the SonicWALL appliance. In any case, the client will be able to directly reach the NPCS, or will be able to reach the NPCS through the SonicWALL. Administrators in a remote location will require some method of VPN connectivity to the internal network. Access from a centralized GMS console will have similar requirements.
Log Persistence
SonicOS currently allocates 32K to a rolling log buffer. When the log becomes full, it can be emailed to a defined recipient and flushed, or it can simply be flushed. Emailing provides a simple version of logging persistence, while GMS provides a more reliable and scalable method.
By offering the administrator the option to deliver logs as either plain-text or HTML, the administrator has an easy method to review and replay events logged.
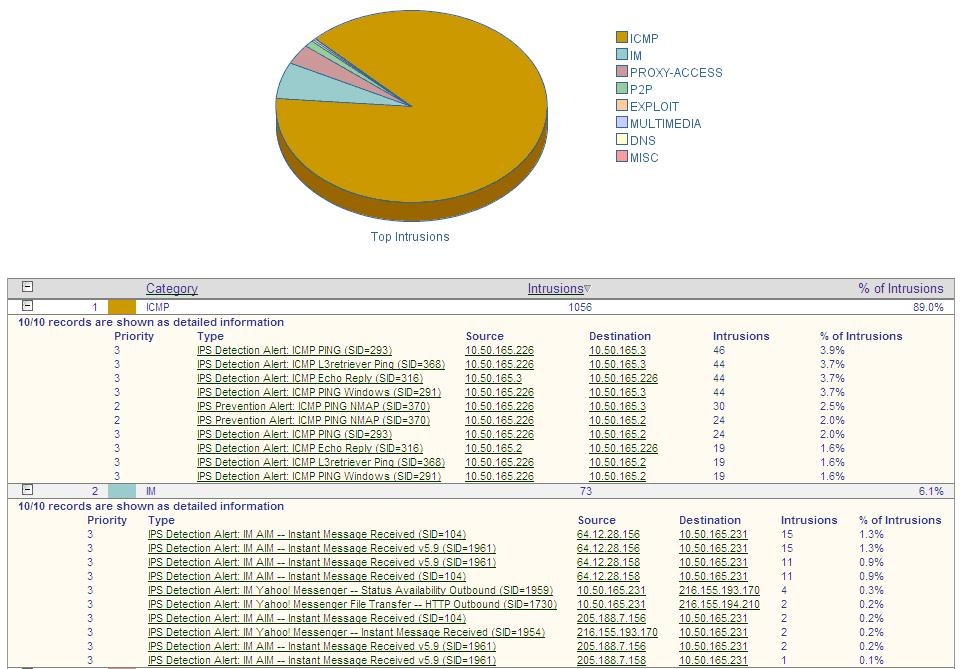
GMS
To provide the ability to identify and view events across an entire enterprise, a GMS update will be required. Device-specific interesting-content events at the GMS console appear in Reports > Log Viewer Search page, but are also found throughout the various reports, such as Top Intrusions Over Time.