System_systemToolsView
The System > Diagnostics page provides several diagnostic tools which help troubleshoot network problems as well as Active Connections, CPU, and Process Monitors.
The Tech Support Report generates a detailed report of the SonicWALL SuperMassive configuration and status, and saves it to the local hard disk using the Download Report button. This file can then be Emailed to SonicWALL Technical Support to help assist with a problem.
Tip You must register your SonicWALL SuperMassive on mysonicwall.com to receive technical support.
Before Emailing the Tech Support Report to the SonicWALL Technical Support team, complete a Tech Support Request Form at https://www.mysonicwall.com. After the form is submitted, a unique case number is returned. Include this case number in all correspondence, as it allows SonicWALL Technical Support to provide you with better service.
Step 1 In the Tech Support Report section, select any of the following four report options:
• VPN Keys - saves shared secrets, encryption, and authentication keys to the report.
• ARP Cache - saves a table relating IP addresses to the corresponding MAC or physical addresses.
• DHCP Bindings - saves entries from the SonicWALL SuperMassive DHCP server.
• IKE Info - saves current information about active IKE configurations.
• Current users - saves current information about active user connections.
• Detail of users - saves current information about active user session details. The Current users report checkbox must be enabled first to obtain this detailed report.
Step 2 Click Download Report to save the file to your system. When you click Download Report, a warning message is displayed.
Step 3 Click OK to save the file. Attach the report to your Tech Support Request Email.
Step 4 To send the TSR, system preferences, and trace log to SonicWALL Engineering (not to SonicWALL Technical Support), click Send Diagnostic Reports. The Status indicator at the bottom of the page displays “Please wait!” while the report is sent, and then displays “Diagnostic reports sent successfully.” You would normally do this after talking to Technical Support.
Step 5 To periodically send the TSR, system preferences, and trace log to MySonicWALL for SonicWALL Engineering, select the Enable Periodic Secure Backup of Diagnostic Reports to MySonicwall checkbox and enter the interval in minutes between the periodic reports in the Time Interval (minutes) field.
You select the diagnostic tool from the Diagnostic Tool drop-down list in the Diagnostic Tool section of the System > Diagnostics page. The following diagnostic tools are available:
• Ping
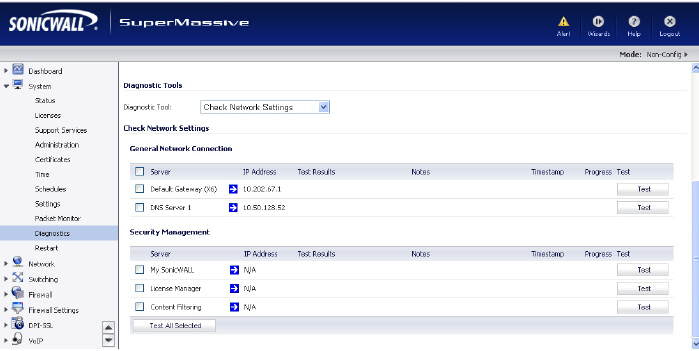
Check Network Settings is a diagnostic tool which automatically checks the network connectivity and service availability of several pre-defined functional areas of SonicOS, returns the results, and attempts to describe the causes if any exceptions are detected. This tool helps administrators locate the problem area when users encounter a network problem.
Specifically, the Check Network Settings tool automatically tests the following functions:
• Default Gateway settings
• DNS settings
• MySonicWALL server connectivity
• License Manager server connectivity
• Content Filter server connectivity
The return data consists of two parts:
• Test Results – Provides a summary of the test outcome
• Notes – Provides details to help determine the cause if any problems exist
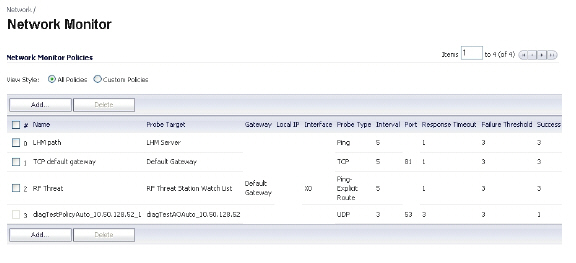
The Check Network Settings tool is dependent on the Network Monitor feature available on the Network > Network Monitor page of the SonicOS management interface. Whenever the Check Network Settings tool is being executed (except during the Content Filter test), a corresponding Network Monitor Policy appears on the Network Monitor page, with a special diagnostic tool policy name in the form “diagTestPolicyAuto_<IP_address>_0”.
To use the Check Network Settings tool, first select it in the Diagnostic Tools drop-down list and then click the Test button in the row for the item that you want to test. The results are displayed in the same row. A green check mark  signifies a successful test, and a red X
  indicates that there is a problem.
To test multiple items at the same time, select the checkbox for each desired item and then click the Test All Selected button.
If there are any failed probes, you can click the blue arrow ![]() to the left of the IP Address field of the failed item to jump to the configuration page to investigate the root cause.
to the left of the IP Address field of the failed item to jump to the configuration page to investigate the root cause.
The Connections Monitor displays real-time, exportable (plain text or CSV), filterable views of all connections to and through the SonicWALL SuperMassive. Click on a column heading to sort by that column.
You can filter the results to display only connections matching certain criteria. You can filter by Source IP, Destination IP, Destination Port, Protocol, Src Interface, and Dst Interface. Enter your filter criteria in the Active Connections Monitor Settings table.
The fields you enter values into are combined into a search string with a logical AND. For example, if you enter values for Source IP and Destination IP, the search string will look for connections matching:
Source IP AND Destination IP
Check the Group box next to any two or more criteria to combine them with a logical OR. For example, if you enter values for Source IP, Destination IP, and Protocol, and check Group next to Source IP and Destination IP, the search string will look for connections matching:
(Source IP OR Destination IP) AND Protocol
Click Apply Filter to apply the filter immediately to the Active Connections Monitor table. Click Reset Filters to clear the filter and display the unfiltered results again.
You can export the list of active connections to a file. Click Export Results, and select if you want the results exported to a plain text file, or a Comma Separated Value (CSV) file for importing to a spreadsheet, reporting tool, or database. If you are prompted to Open or Save the file, select Save. Then enter a filename and path and click OK.
The Multi-Core Monitor displays dynamically updated statistics on utilization of the individual cores of the SonicWALL SuperMassive. Core 1 through core 8 handles the control plane. Core 1 through core 8 usage is displayed in green on the Multi-Core Monitor. The remaining cores handle the data plane. To maximize processor flexibility, functions are not dedicated to specific cores; instead all cores can process all data plane tasks. Memory is shared across all cores. Each core can process a separate flow simultaneously, allowing for up to 88 flows to be processed in parallel.
The Core Monitor displays dynamically updated statistics on the utilization of a single specified core on the SonicWALL SuperMassives. The View Style provides a wide range of time intervals that can be displayed to review core usage.
The Link Monitor displays bandwidth utilization for the interfaces on the SonicWALL SuperMassive. Bandwidth utilization is shown as a percentage of total capacity. The Link Monitor can be configured to display inbound traffic, outbound traffic or both for each of the physical interfaces on the appliance.
The Packet Size Monitor displays sizes of packets on the interfaces on the SonicWALL SuperMassive. You can select from four time periods, ranging from the last 30 seconds to the last 30 days. The Packet Size Monitor can be configured to display inbound traffic, outbound traffic or both for each of the physical interfaces on the appliance.

Step 1 Select one of the following from the View Style drop-down list:
– Last 30 Seconds
– Last 30 Minutes
– Last 24 Hours
– Last 30 Days
Step 2 Select the physical interface to view from the Interface Name drop-down list.
Step 3 In the Direction drop-down list, select one of the following:
– Both – Select for packets traveling both inbound and outbound
– Ingress – Select for packets arriving on the interface
– Egress – Select for packets departing from the interface
The packets are displayed in the Average Packet Size graph, where the X axis specifies when the packets crossed the interface and the Y axis specifies the average packet size at that time. Ingress packets are displayed in green, and egress packets are displayed in red.
The SonicWALL SuperMassive has a DNS lookup tool that returns the IP address of a domain name. Or, if you enter an IP address, it returns the domain name for that address.
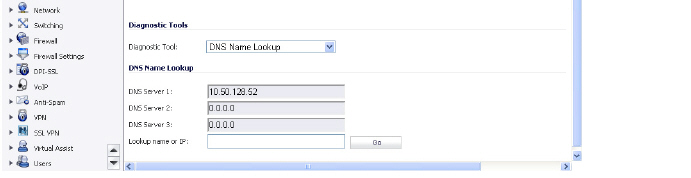
Step 1 Enter the host name or IP address in the Look up name field. Do not add http to the host name.
Step 2 The SonicWALL SuperMassive queries the DNS Server and displays the result in the Result section. It also displays the IP address of the DNS Server used to perform the query.
The DNS Name Lookup section also displays the IP addresses of the DNS Servers configured on the SonicWALL SuperMassive. If there is no IP address or IP addresses in the DNS Server fields, you must configure them on the Network > Settings page.
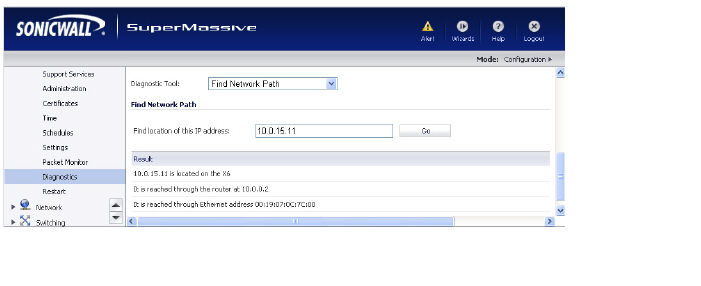
Enter an IP address to determine the network path is located on a specific network interface, reached a router gateway IP address, and reached through an Ethernet address.
The Ping test bounces a packet off a machine on the Internet and returns it to the sender. This test shows if the SonicWALL SuperMassive is able to contact the remote host. If users on the LAN are having problems accessing services on the Internet, try pinging the DNS server, or another machine at the ISP location. If the test is unsuccessful, try pinging devices outside the ISP. If you can ping devices outside of the ISP, then the problem lies with the ISP connection.
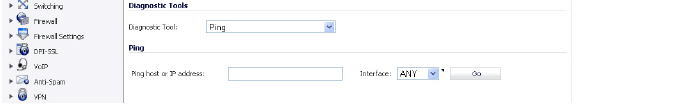
Step 1 Select Ping from the Diagnostic Tool menu.
Step 2 Enter the IP address or host name of the target device and click Go.
Step 3 In the Interface pull-down menu, select which WAN interface you want to test the ping from. Selecting ANY allows the appliance to choose among all interfaces—including those not listed in the pull-down menu.
Step 4 If the test is successful, the SonicWALL SuperMassive returns a message saying the IP address is alive and the time to return in milliseconds (ms).
The Real-Time Black List Lookup tool allows you to test SMTP IP addresses, RBL services, or DNS servers. Enter an IP address in the IP Address field, a FQDN for the RBL in the RBL Domain field and DNS server information in the DNS Server field. Click Go.Reverse Name Resolution
The Reverse Name Resolution tool is similar to the DNS name lookup tool, except that it looks up a server name, given an IP address.
Enter an IP address in the Reverse Lookup the IP Address field, and it checks all DNS servers configured for your security appliance to resolve the IP address into a server name.
The Connection Limit TopX tool lists the top 10 connections by the source and destination IP addresses. Before you can use this tool, you must enable source IP limiting and/or destination IP limiting for your appliance. If these are not enabled, the page displays a message to inform you that you can enable them on the Firewall > Advanced page.
The MX Lookup and Banner Check tool allows you to look up a domain or IP address. Your configured DNS servers are displayed in the DNS Server 1/2/3 fields, but are not editable. After you type a domain name, such as “google.com” into the Lookup name or IP field and click Go, the output is displayed under Result. The results include the domain name or IP address that you entered, the DNS server from your list that was used, the resolved email server domain name and/or IP address, and the banner received from the domain server or a message that the connection was refused. The contents of the banner depends on the server you are looking up.
Trace Route is a diagnostic utility to assist in diagnosing and troubleshooting router connections on the Internet. By using Internet Connect Message Protocol (ICMP) echo packets similar to Ping packets, Trace Route can test interconnectivity with routers and other hosts that are farther and farther along the network path until the connection fails or until the remote host responds.
Step 1 Select Trace Route from the Diagnostic Tool menu.
Step 2 Type the IP address or domain name of the destination host in the TraceRoute this host or IP address field.
Step 3 In the Interface pull-down menu, select which interface you want to test the trace route from. Selecting ANY allows the appliance to choose among all interfaces—including those not listed in the pull-down menu.
Step 4 Click Go.
A second window is displayed with each hop to the destination host. By following the route, you can diagnose where the connection fails between the SonicWALL SuperMassive and the destination.
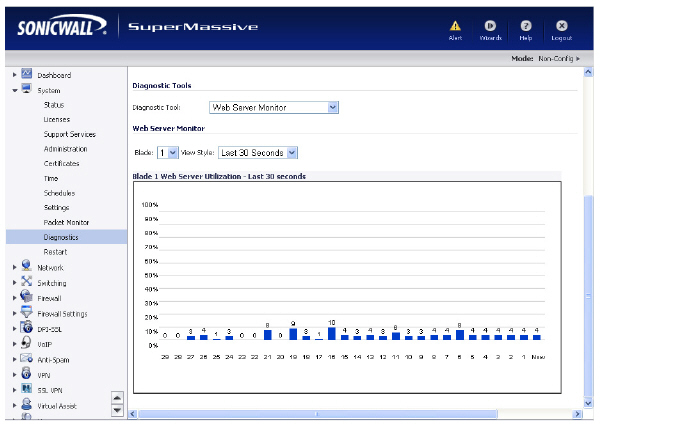
The Web Server Monitor tool displays the CPU utilization of the Web server over several periods of time. The time frame of the Web Server Monitor can be changed by selecting one of the following options in the View Style pull-down menu: last 30 seconds, last 30 minutes, last 24 hours, or last 30 days.
The User Monitor tool displays the number users of logged in over several periods of time. The time frame of the User Monitor can be changed by selecting one of the following options in the View Style pull-down menu: last 30 minutes, last 24 hours, or last 30 days.