Log_logReadView
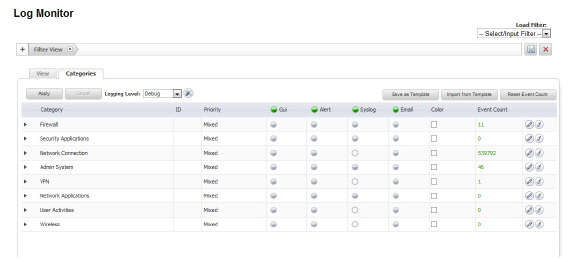
Log > Log Monitor
The SonicWALL security appliance maintains an Event log for tracking potential security threats. This log can be viewed in the Log > Log Monitor page, or it can be automatically sent to an e-mail address for convenience and archiving. It can also be accessed via the Dashboard > Log Monitor view.
The information displayed is easily controlled by setting options for which categories you want to display in the log table. Use the Categories tab to determine the baseline events to monitor and to configure event-specific information.
Email alerts sent from the Log Monitor can alert you to important events, such as an attack to the SonicWALL security appliance. Alerts are immediately e-mailed, either to an e-mail address or to an e-mail pager. Each log entry contains the date and time of the event and a brief message describing the event.
On the Log Monitor page, two tabs are available: View and Categories.
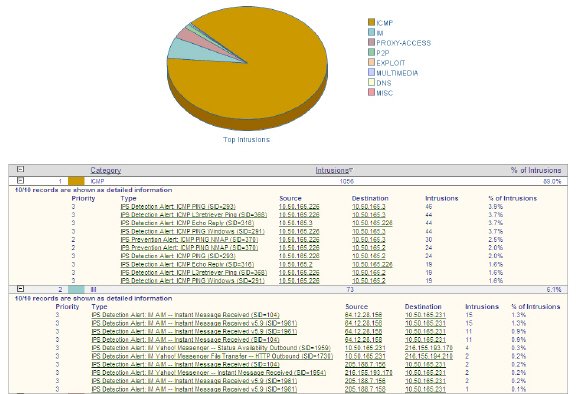
Log View Table
Click the View tab to see the log. This log is displayed in a table and is sortable by column. The column values can be customized as discussed below.
The available log table columns include:
Specify a priority level on a SonicWALL security appliance on the Categories tab to log messages for that priority level, plus all messages tagged with a higher severity. For example, on the Logging Level dropdown on the Categories tab, select ‘error’ as the priority level to log all messages tagged as ‘error,’ as well as any messages tagged with ‘critical,’ ‘alert,’ and ‘emergency.’ Select ‘debug’ to log all messages.
Note: Refer to Log Event Messages section for more information on your specific log event.
The categories displayed can vary, depending on the browser in use.
Filtering the Log View
The filter bar allows you to filter the logs based on selected criteria, as well as save the filtered log view to a file.
The filter criteria will be applied to the display, and you will see the filter type in the filter bar.
Working with the Log View Entries
The Log View table provides numerous settings to allow you to navigate, view, and export results.
Table columns can be customized, so that you can view full data on any event, or only the data you need.
Table entries can be sorted to display in either ascending or decending order.
Interval Field
The Interval field, allows you to customize settings to view a specific timeframe, ranging from the last 30 minutes to the last 30 days, or all logs in the database, to find items of interest. Use Events Since: to specify the desired timeframe in the dropdown menu.
Sorting Entries
You can sort the entries in the View table by clicking on the column header. The entries are sorted by ascending or descending order. The arrow to the right of the column entry indicates the sorting status. A down arrow means ascending order. An up arrow indicates a descending order.
Export Log

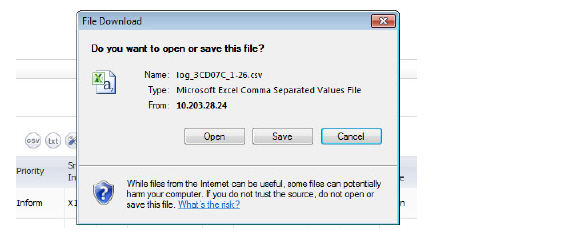
Two buttons, marked CSV and TXT allow you to export the log file. You can export log content to two formats:
When either of these are selected, a dialog will appear, asking if you wish to open or save the file.
Select Columns
Clicking the Select Columns button allows you to customize the table to display only those items of interest. When you click on the button, a popup menu appears, from which you can select those columns you wish to display.
Click the check-boxes for the columns you wish to appear in your display. The options may differ, depending on the browser you are using.
Additional Functions
Additional functions are provided by the navigation buttons above the Log Monitor table. These buttons are located in the center above and to the top right of the Log View table.
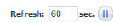
At the far right of the table, you can specify how often the status should be sampled. The default is to refresh ever 60 seconds, but other intervals can be specified. To refresh all output immediately, click on the button to the right of the Refresh field.

The far left button of the center group refreshes the table on demand, independent of the time specified for the refresh cycle. To update log messages, clicking the Refresh button.
The middle button sends the log to a designated email address.
The right button is the Clear Log button. To delete the contents of the log, click the Clear Log button.
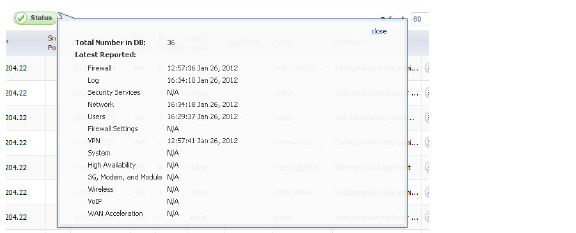
Show Status
The Show Status button displays the total number of logs present in the database, as well as the latest reported time for each status category.
The Categories Tab
The Categories tab allows you to configure event-specific information, including priority, stream filter, color, and email address to which status and alerts are sent.
Using this tab, you can also apply or export templates, set the desired level of logging, and reset the event count.
Logging Level
The logging level sets up the baseline logging level to be displayed on the View page. All events with a higher priority than the selected entry will be logged. For instance, select error as the priority level to log all messages tagged as ‘error,’ as well as any messages tagged with critical, alert, and emergency.
Select Debug to display all events.
By clicking the tool button next to the Logging Levels, you can set up email addresses where the logs and alerts can be sent, and push attributes to the global categories. However, individual category emails must still be configured. The global setting will not be applied to them.
Click Apply to apply the logging level to the View table.
Category Settings
The Category table lists the types of services. You can use the arrows to expand this column to see more detail and set up parameters for the alerts. Individual items under the broader category can be configured.

To set the options displayed in the column headings, click on the pencil icon to edit the settings.
You can reset the event count for an individual category by clicking the brush icon or reset the total even count by clicking the Reset Event Count button at the upper right.
Filtering Category Listings
Categories can be filtered by using the filter bar to set up expressions. Click on the + sign to add a filter. The Category Filter Statement menu appears.

Enter a key and value or values to use. In the example above, you would filter on all Rule categories. The resulting category list would appear as follows:

Only categories with relevance to Rules are displayed.
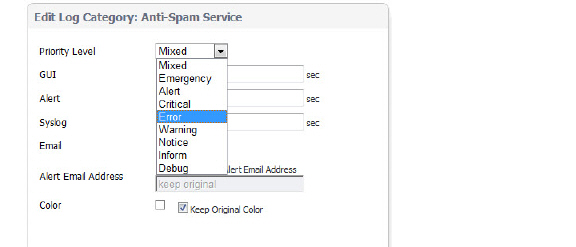
Edit the Event Configuration
Click the pencil icon to edit the event configuration. You can configure event priority, filters, and colors, and specify the email addresses to which log entries can be sent.
Syslog uses eight Priority Level categories to characterize messages. These categories, in descending order of severity, are:
A specified category level will log messages for that priority level, plus all messages tagged with a higher severity. Debug logs all messages. Mixed displays all messages in multiple categories.
For example, to log all messages tagged as Error, as well as any messages tagged with Critical, Alert, and Emergency.
Alerts in the Mixed group within a category can be set to the same value, or can have different checkbox values.
Display Category Options
Check the box by GUI to enable displaying the category in the GUI and set the redundancy in the sec. field.
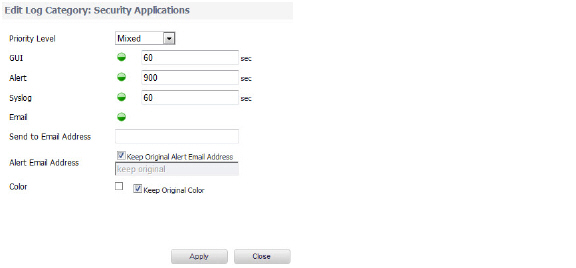
You can enable sending Alert and Syslog messages and set their redundancy times either by overall category or by groups within the category.
The Email button enables sending log emails to the specified system email address. Each category can add an email address separate from the global email address. If a category-specific address is specified, logs from this category will be sent to both the category and global email addresses.
The SonicWALL security appliance can alert you to important events, such as an attack to the SonicWALL security appliance. Alerts are immediately sent via e-mail, either to an e-mail address or to an e-mail pager. By default, alerts are sent to the e-mail address and server information in the Log > Automation page.However, you can also specify an email address to be used for a particular alert. To do this, uncheck Keep Original Alert Email Address and enter the new address for the Alert.
You can also specify a color for an alert. If a new color is specified, a color palette display will pop up, allowing you to chose the displayed color.

Log Event Messages
For a complete reference guide of log event messages, refer to the SonicWALL Log Event Reference Guide.
Deep Packet Forensics
SonicWALL UTM appliances have configurable deep-packet classification capabilities that intersect with forensic and content-management products. While the SonicWALL can reliably detect and prevent any ‘interesting-content’ events, it can only provide a record of the occurrence, but not the actual data of the event.
Of equal importance are diagnostic applications where the interesting-content is traffic that is being unpredictably handled or inexplicably dropped.
Although the SonicWALL can achieve interesting-content using our Enhanced packet capture diagnostic tool, data-recorders are application-specific appliances designed to record all the packets on a network. They are highly optimized for this task, and can record network traffic without dropping a single packet.
While data-recorders are good at recording data, they lack the sort of deep-packet inspection intelligence afforded by IPS/GAV/ASPY/AF. Consider the minimal requirements of effective data analysis:
Together, a UTM device (a SonicWALL appliance) and data-recorder (a Solera Networks appliance) satisfy the requirements to offer outstanding forensic and data-leakage capabilities.
Distributed Event Detection and Replay
The Solera appliance can search its data-repository, while also allowing the administrator to define “interesting-content” events on the SonicWALL. The level of logging detail and frequency of the logging can be configured by the administrator. Nearly all events include Source IP, Source Port, Destination IP, Destination Port, and Time. SonicOS Enhanced has an extensive set of log events, including:
The following is an example of the process of distributed event detection and replay:
Methods of Access
The client and NPCS must be able to reach one another. Usually, this means the client and the NPCS will be in the same physical location, both connected to the SonicWALL appliance. In any case, the client will be able to directly reach the NPCS, or will be able to reach the NPCS through the SonicWALL. Administrators in a remote location will require some method of VPN connectivity to the internal network. Access from a centralized GMS console will have similar requirements.
Log Persistence
SonicOS currently allocates 32K to a rolling log buffer. When the log becomes full, it can be emailed to a defined recipient and flushed, or it can simply be flushed. Emailing provides a simple version of logging persistence, while GMS provides a more reliable and scalable method.
By offering the administrator the option to deliver logs as either plain-text or HTML, the administrator has an easy method to review and replay events logged.
GMS
To provide the ability to identify and view events across an entire enterprise, a GMS update will be required. Device-specific interesting-content events at the GMS console appear in Reports > Log Viewer Search page, but are also found throughout the various reports, such as Top Intrusions Over Time.