log_settings
This chapter provides configuration tasks to enable you to categorize and customize the logging functions on your Dell SonicWALL security appliance for troubleshooting and diagnostics.
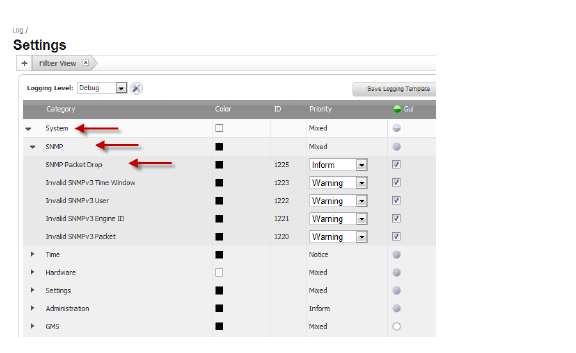
The Category column of the Log Monitor table has three levels: category, group, and event. The first level of the tree structure is category. The second level is group. The third level is event. Clicking the small black triangle expands or collapses the category or group contents.
In the following graphic, System is at the first level–category. SNMP is at the second level–group. SNMP Packet Drop, and the items below it on the same level, are at the third level–event.
This section provides information on configuring the level of priority of log messages that are captured, and the corresponding alert messages that are sent through Email for notification.
Note: Alert Emails are sent when the Send Log to E-mail Address option and the Send Alerts to E-mail Address option are configured on the Log > Automation page.
Setting the Logging Level
The Logging Level allows the firewall administrator to filter events by priority. Events with equal or greater priority are passed. Events with a lower priority are dropped. This enables the firewall administrator to filter out lower level priorities to prevent them being logged in the system.
On the Log > Settings page, you can set the baseline logging level to be displayed on the Log Monitor page. The following logging levels are available for selection:
: •: Emergency
: •: Alert
: •: Critical
: •: Error
: •: Warning
: •: Notice
: •: Inform
: •: Debug
To set the logging level:
Step 1: Go to the Log > Settings page.
Step 2: From the Logging Level menu, select the logging level you want.

All events with a higher priority than the selected entry are logged.
For example, if you select error as the logging level, all messages tagged as error, as well as all messages with a higher priority such as critical, alert, and emergency, are also displayed.
To display all events:
: •: Select Debug as the logging level.
Editing the Global Category Attributes
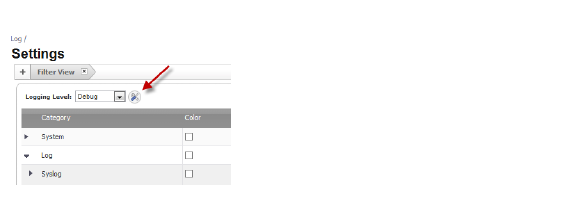
Clicking the tool button next to the Logging Level box launches the Edit Attributes of All Categories dialog. This dialog enables you to set the attributes for all events in all categories or in all groups.
You can set the priority for each category or group, and all the events under that category or group will have that same priority. You can also specify Email addresses where the logs and alerts can be sent.
The Redundancy Filter Interval boxes enable you to enter time intervals (in seconds) to avoid duplication of a log message within an interval. The range for these intervals is 0 to 86400 seconds. For Syslog messages, the interval is set to 90 seconds. For alert messages, the interval is set to 900 seconds.
To Edit the Category Attributes Globally:
Step 1: Go to the Log > Settings page.
Step 2: Click the tool button.
The Edit Attributes of All Categories dialog appears.
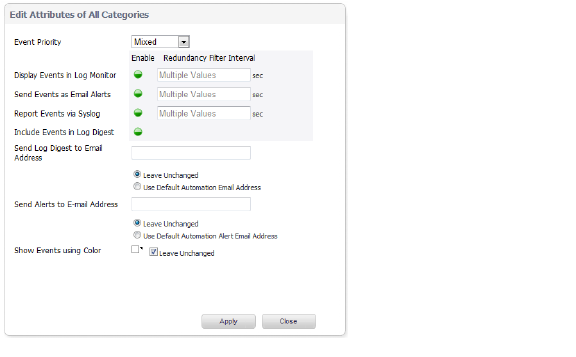
Step 3: From the Event Priority menu list, select the priority that want.
Under Enable Redundancy Filter Interval:
Step 4: If you want to display the log events in the Log Monitor, select the Enable button for the Display Events in Log Monitor option.
Note: The Enable buttons are green when they are selected, white when they are not selected, and semi-solid when they are unchanged. When the boxes say, “Multiple Values”, the values are unchanged also.
Step 5: In the Display Events in Log Monitor box, enter the number of seconds for the Log Monitor to refresh its data. The range is 0 to 86400.
Step 6: If you want to send events as email alerts, select the Enable button for the Send Events as Email Alerts option.
Step 7: In the Send Events as Email Alerts box, enter the number of seconds for the Log Monitor to refresh its data. The range is 0 to 86400.
Step 8: If you want to report events via Syslog, select the Enable button for the Report Events via Syslog option.
Step 9: In the Report Events via Syslog box, enter the number of seconds for the Log Monitor to refresh its data. The range is 0 to 86400.
Step 10: If you want to send the global event log via Email, enter the Email address in the Send Log Digest to Email Address box.
Step 11: If you want to keep using this Email address even when you change other values in this dialog, select the Leave Unchanged option.
Step 12: If you want to use the same Email address that is entered in the Log > Automation page to send the global event log, select the Use Default Automation Email Address option.
Step 13: If you want to send alerts via Email based on the global settings in this dialog, enter the Email address in the Send Alerts to E-mail Address box.
Step 14: If you want to keep using this Email address even when you change other values in this dialog, select the Leave Unchanged option.
Step 15: If you want to use the same Email address that is entered in the Log > Automation page to send global alerts, select the Use Default Automation Email Address option.
Step 16: If you want to use a specific color for the global events log, uncheck the Leave Unchanged option. The color selection matrix appears.
Step 17: Select the color you want.
Step 18: Click Apply.
Configuring Category Attributes in Columns
On the Log > Settings page, the columns show the configuration settings for each row.
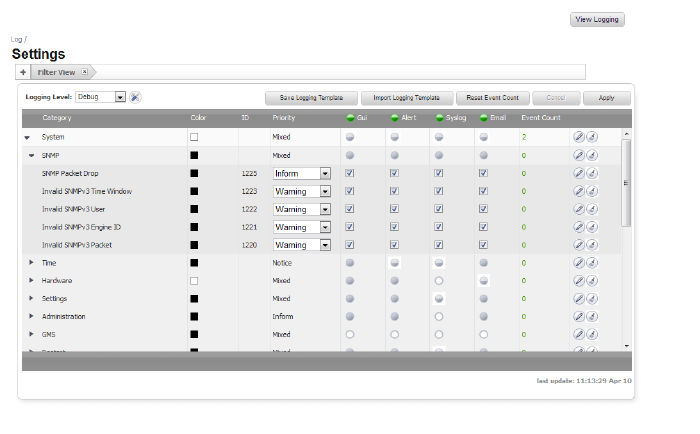
Only items at the event level can be configured in the rows and columns. Items at the group level and category level only display the configuration information. To configure the items at the group level or the category level, you must use the Edit Log Group or Edit Log Category dialogs that appear when you click the Configure button at the end of the row. You can also configure events by clicking on the configure button, which launches the Edit Log Event dialog.
Color Column
The Color column shows the color with which the event, group, or category is highlighted in the Log Monitor table.
ID Column
The ID column shows the ID number of the event.
Priority Column
The Priority column shows the severity or priority of a category, group, or event. For events, a menu is provided that lists the selectable priorities. For categories and groups, the priorities are listed in the dialog when you click the Configure button at the end of the row.
The available priorities are:
: •: Emergency
: •: Alert
: •: Critical
: •: Error
: •: Warning
: •: Notice
: •: Inform
: •: Debug
GUI Column
The GUI column shows checkboxes that indicate whether this event is displayed in the Log Monitor. For events, you can show or hide the event by selecting or unselecting the checkbox in the column. For categories and groups, you must use the configure dialog.
Alert Column
The Alert column shows checkboxes that indicate whether an Alert message will be sent for this event, group, or category.
Syslog Column
The Syslog column shows checkboxes that indicate whether the event, group, or category will be sent to a Syslog server.
Email Column
The Email column shows checkboxes that indicate whether the log will be Emailed to the configured address. For events, these checkboxes are configurable in the column. For categories and groups, Email is configured in the Edit Log Group or Edit Log Category dialogs that appear when you click the Configure button at the end of the row.
Event Count Column
The Event Count column shows the number of times that this event has occurred. For groups and categories, it shows the number of times that this event has occurred for that group or category.
Configure and Reset Buttons
The Configure and Reset buttons appear at the end of each row.

Configure Button
The Configure button launches the Edit Log Event, Edit Log Group, or Edit Log Category dialog. You can configure all of the attributes for an event, group, or category.
Reset Button
The Reset button resets the event counter for an event, a group, or a category, and the event counters of higher levels are recalculated.
Top Row Buttons
In the Log > Settings table, the top row has the following buttons:
: •: Save Logging Template
: •: Import Logging Template
: •: Reset Event Count

Save to Template
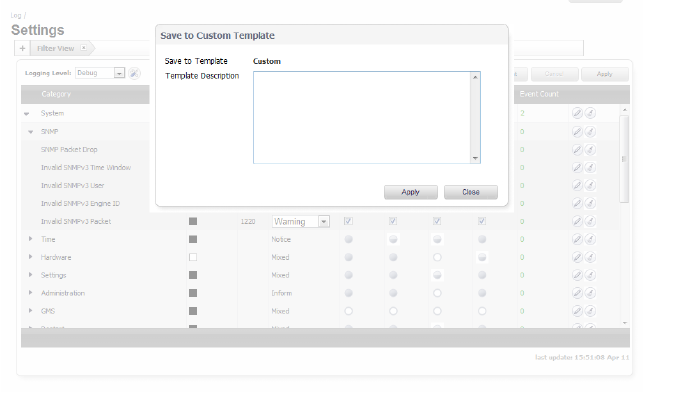
The Save to Template button exports the current configured Log Settings to the Custom template. It also lets you enter a description for the Custom template.
There are four Log Setting templates: Default, Minimal, Analyzer/Viewpoint/GMS, and Custom. Only the Custom template can be modified and saved, and there is only one custom template. Each time the custom template is saved, the old custom template is overwritten.
Import Logging Template
The Import Logging Template button allows you to select and import one of the following four templates:
: •: Default Template
: •: Minimal Template
: •: Analyzer/Viewpoint/GMS Template
: •: Custom Template

Note: The Default, Minimal, and Analyzer/Viewpoint/GMS templates are defined at the factory.
Default Template
The Default template restores all log event settings to the Dell/Dell SonicWALL default values.
This includes the following settings for each log event:
: •: Priority Level
: •: GUI
: •: Alert
: •: Syslog
: •: Email Filter
: •: Filter Interval
: •: Email Address
: •: Alert Email Address
: •: Color
Minimal Template
The minimal template keeps the generated logs at a minimum level, while still providing sufficient information about the most important events on the firewall. The minimal template disables the non-critical filters: GUI, Alert, Syslog, and Email.
Analyzer/Viewpoint/GMS Template
This template is factory configured to ensure that the firewall works well with the Analyzer, Viewpoint, or GMS server. All related events are configured to meet the server requirements.
All configurations are limited to the Syslog filter/filter interval. This template affects only the Syslog filter/filter interval.
Custom Template
The Custom template is defined by the current configured Log Settings, and can be modified by the firewall administrator. The Save to Template button exports the current configured Log Settings to the Custom template. It also lets you enter a description for the Custom template.
Reset Event Count
The Reset Event Count button sets all the event counters to zero (0).
Apply
The Apply button applies the currently imported log settings to the Log Monitor.