Log_logFlowReportingView
The AppFlow > Flow Reporting page includes settings for configuring the SonicWALL SuperMassive to view statistics based on Flow Reporting and Internal Reporting. From this screen, you can also configure settings for internal reporting and appflow server reporting.
This chapter contains the following sections:
• Settings
• NetFlow Activation and Deployment Information
This section shows reports of the flows that are sent to the server, not collected, dropped, stored in and removed from the memory, reported and non-reported to the server. This section also includes the number of NetFlow and IP Flow Information Export (IPFIX) templates sent and general static flows reported.
|
The Settings section has configurable options for local internal flow reporting, AppFlow Server external flow reporting, and the IPFIX collector.
• Send AppFlow To Local Collector—This setting enables AppFlow reporting collection to an internal server on your SonicWALL SuperMassive.
• Enable Real-Time Data Collection—This settings enable real-time data collection on your SonicWALL SuperMassive. When this setting is disabled, the Real-Time Monitor does not collect or display streaming data.
– Collect Real-Time Data For—Select from this pull-down menu the streaming-graphs to display on the Real-Time Monitor page:
: •: Top Apps—Displays the Applications graph.
: •: Bits per second—Displays the Bandwidth graph.
: •: Packets per second—Displays the Packet Rate graph.
: •: Average packet size—Displays the Packet Size graph.
: •: Connections per second—Displays the Connection Rate and Connection Count graphs.
: •: Core utility—Displays the Multi-Core Monitor graph.
: •: Memory utility—Displays the Memory Usage graph.
• Enable Aggregate AppFlow Report Data Collection—This setting enables AppFlow Reports collection on your SonicWALL SuperMassive. When this setting is disabled, the AppFlow Reports does not collect or display data.
This section provides the network administrator the ability to start sending AppFlow data and Real-Time data to an external SonicWALL AppFlow Server.
• Send AppFlow To SonicWALL AppFlow Server—This setting allows you to start sending AppFlow records to an external AppFlow Server.
• Send Real-Time Data To SonicWALL AppFlow Server—This setting allows you to start sending real-time records to an external AppFlow Server.
This section provides configuration settings for AppFlow reporting to an external IPFIX collector.
• Send AppFlow and Real-Time Data To External Collector—Selecting this checkbox enables the specified flows to be reported to an external flow collector.
• External AppFlow Reporting Format—If the “Report to EXTERNAL Flow Collector” option is selected, you must specify the flow reporting type from the provided list in the drop-down menu: NetFlow version-5, NetFlow version-9, IPFIX, or IPFIX with extensions. If the reporting type is set to Netflow versions 5, 9, or IPFIX, then any third-party collector can be used to show flows reported from the device. It uses standard data types as defined in IETF. If the reporting type is set to IPFIX with extensions, then the collectors that are SonicWALL flow aware can only be used.
Note When using IPFIX with extensions, select a third-party collector that is SonicWALL flow aware, such as SonicWALL Scrutinizer.
For Netflow versions and IPFIX reporting types, only connection related flows are reported per the standard. For IPFIX with extensions, connection related flows are reported with SonicWALL specific data type, as well as various other tables to correlate flows with Users, Applications, Viruses, VPN, and so on.
• : : : : External Collector’s IP Address—Specify the external collector’s IP address. This IP address must be reachable from the SonicWALL firewall in order for the collector to generate flow reports.
• Source IP to Use for Collector on a VPN Tunnel—If the external collector must be reached by a VPN tunnel, specify the source IP for the correct VPN policy. Note: Select Source IP from the local network specified in the VPN policy. If specified, Netflow/IPFIX flow packets will always take the VPN path.
• External Collector’s UDP Port Number—Specify the UDP port number that Netflow/IPFIX packets are being sent over. The default port is 2055.
• Send IPFIX/Netflow Templates at Regular Intervals—Selecting this checkbox will enable the appliance to send Template flows at regular intervals. Netflow version-9 and IPFIX use templates that must be known to an external collector before sending data. Per IETF, a reporting device must be capable of sending templates at a regular interval to keep the collector in sync with the device. If the collector does not need templates at regular intervals, you may disable it here. This option is available with Netflow version-9, IPFIX, and IPFIX with extensions only.
• Send Static AppFlow at Regular Interval—Selecting this checkbox enables the sending of these specified appflows.
– Send Static AppFlow for Following Tables—Select the static mapping tables to be generated to a flow from the drop-down list. Values include: Applications, Viruses, Spyware, Intrusions, Location Map, Services, Rating Maps, Table Map, and Column Map. For more information on static tables, refer to the NetFlow Tables.
When running in IPFIX with extensions mode, SonicWALL reports multiple types of data to an external device in order to correlate User, VPN, Application, Virus, and Spyware information. In this mode, data is both static and dynamic. Static tables are needed only once since they rarely change. Depending on the capability of the external collector, not all static tables are needed. You can select the tables needed in this section. This option is available with IPFIX with extensions only.
• Send Dynamic AppFlow for Following Tables—Select the dynamic mapping tables to be generated to a flow from the drop-down list. Values include: Connections, Users, URLs, URL Ratings, VPNs, Devices, SPAMs, Locations, and VoIPs. For more information on dynamic tables, refer to the NetFlow Tables.
• Include Following Additional Reports via IPFIX—Select additional IPFIX reports to be generated to a flow. Select values from the drop-down list. Values include: Top 10 Apps, Interface Stats, Core Utilization, and Memory Utilization.
When running in IPFIX with extensions mode, SonicWALL is capable of reporting more data that is not related to connection and flows. These tables are grouped under this section (Additional Reports). Depending on the capability of the external collector, not all additional tables are needed. In this section, users can select tables that are needed. This option is available with IPFIX with extensions only.
• Actions—Click the Generate ALL Templates button to begin building templates on the IPFIX server, this will take up to two minutes to generate. Click the Generate Static AppFlow Data button to begin generate a large amount of flows to the IPFIX server, this will take up to two minutes to generate.
This section allows the network administrator to configure conditions under which a connection is reported.
• Report Connections—Select from All or Interface-based or Firewall/App Rules-based connection reporting. Note that this option is applicable to both internal and external flow reporting.
– All—Selecting this checkbox enables any connection reporting.
– Interface-based—Selecting this checkbox enables flow reporting based only on the initiator or responder interface. This provides a way to control what flows are reported externally or internally. If enabled, the flows are verified against the per interface flow reporting configuration, located in the Network > Interface screen. If an interface has its flow reporting disabled, then flows associated with that interface are skipped.
Firewall/App Rules-based—Selecting this checkbox enables flow reporting based on already existing firewall rules. This is similar to interface-based reporting; the only difference is instead of checking per interface settings, the per firewall rule is selected. Every firewall rule has a checkbox to enable flow reporting. If a flow matching a firewall rule is to be reported, this enabled checkbox will force to verify if firewall rules have flow reporting enabled or not. Note that if this option is enabled and no rules have the flow reporting option enabled, no data will be reported. This option is an additional way to control which flows need to be reported.
• Report on Connection OPEN—Enable this to report flows when the connection is open. This is typically when a connection is established.
• Report on Connection CLOSED—Enable this to report flows when the connection is closed.
• Report Connection on Active Timeout—Enable this to report connections based on an Active Timeout sessions.
– Number of Seconds—Set the number of seconds to elapse for the Active Timeout. The default setting is 60 seconds. You can set from 1 second to 999 seconds for the Active Timeout.
• Report Connection on Kilo BYTES Exchanged—Enable this to report flows based on a specific number of traffic, in kilobytes, is exchanged. This option is ideal for flows that are active for a long time and need to be monitored.
– Kilobytes Exchanged—When the above option is enabled, specify the number of kilobytes exchanged to be reported.
– Report ONCE—When the Report Connection on Kilo BYTES exchanged option is enabled, enabling this option will send the report only once. Leave it unselected if you want reports sent periodically.
• Report Connections on Following Updates—Select from the pull-down menu to enable connection reporting for the following:
– Threat Detection—Enable this to report flows specific to threats. Upon detections of virus, intrusion, or spyware, the flow is reported again.
– Application Detection—Enable this to report flows specific to applications. Upon performing a deep packet inspection, the Dell SonicWALL network security appliance is able to detect if a flow is part of a certain application. Once identified, the flow is reported again.
– User Detection—Enable this to report flows specific to users. The Dell SonicWALL network security appliance associates flows to a user-based detection based on its login credentials. Once identified, the flow is reported again.
– VPN Tunnel Detection—Enable this to report flows sent through the VPN tunnel. Once flows sent over the VPN tunnel are identified, the flow is reported again.
This section allows the network administrator to configure conditions under which a connection is reported.
• Report DROPPED Connections—Enable this to report dropped connections. This applies to connections that are dropped due to firewall rules.
• Skip Reporting of STACK Connections—Enable this to skip the reporting of STACK connections. Note that all flows as a result of traffic initiated or terminated by the SonicWALL SuperMassive are considered stack traffic.
• Include following URL types—Select the type of URLS to be generated into a flow. Select values from the drop-down list. Values include: Gifs, Jpegs, Pngs, Js, Xmls, Jsons, Css, Htmls, Aspx, and Cms. This option applies to both AppFlow (internal) and external reporting when used with IPFIX with extensions.
NetFlow Activation and Deployment Information
SonicWALL recommends careful planning of NetFlow deployment with NetFlow services activated on strategically located edge/aggregation routers which capture the data required for planning, monitoring and accounting applications. Key deployment considerations include the following:
• Understanding your application-driven data collection requirements: accounting applications may only require originating and terminating router flow information whereas monitoring applications may require a more comprehensive (data intensive) end-to-end view
• Understanding the impact of network topology and routing policy on flow collection strategy: for example, avoid collecting duplicate flows by activating NetFlow on key aggregation routers where traffic originates or terminates and not on backbone routers or intermediate routers which would provide duplicate views of the same flow information
• NetFlow can be implemented in the SonicOS management interface to understand the number of flow in the network and the impact on the router. NetFlow export can then be setup at a later date to complete the NetFlow deployment.
NetFlow is in general an ingress measurement technology which should be deployed on appropriate interfaces on edge/aggregation or WAN access routers to gain a comprehensive view of originating and terminating traffic to meet customer needs for accounting, monitoring or network planning data. The key mechanism for enhancing NetFlow data volume manageability is careful planning of NetFlow deployment. NetFlow can be deployed incrementally (i.e. interface by interface) and strategically (i.e. on well chosen routers) —instead of widespread deployment of NetFlow on every router in the network.
Depending on the type of flows you are collecting, you will need to determine which type of reporting will work best with your setup and configuration. This section includes configuration examples for each supported NetFlow solution, as well as configuring a second appliance to act as a collector.
• NetFlow Version 5 Configuration Procedures
• NetFlow Version 9 Configuration Procedures
• IPFIX (NetFlow Version 10) Configuration Procedures
NetFlow Version 5 Configuration Procedures
To configure typical Netflow version 5 flow reporting, follow the steps listed below.
1. In External Collector Settings, select the Send AppFlow and Real-Time Data To External Collector checkbox.
2. Select Netflow version-5 as the External Flow Reporting Format from the drop-down list.
3. Specify the External Collector’s IP address in the provided field.
4. For the Source IP to Use for Collector on a VPN Tunnel, specify the source IP if the external collector must be reached by a VPN tunnel. Note that this step is optional.
5. Specify the External Collector’s UDP port number in the provided field. The default port is 2055.
6. In the Connection Report Settings and Report Connections, select the Interface-based checkbox. Once enabled, the flows reported are based on the initiator or responder interface. Note that this step is optional.
7. In the Connection Report Settings and Report Connections, select the Firewall/App Rules-based checkbox. Once enabled, the flows reported are based on already existing firewall rules. Note that this step is optional, but is required if flow reporting is done on selected interfaces.
NetFlow Version 9 Configuration Procedures
To configure Netflow version 9 flow reporting, follow the steps listed below.
1. In External Collector Settings, select the Send AppFlow and Real-Time Data To External Collector checkbox.
2. Select Netflow version-9 as the External Flow Reporting Format from the drop-down list.
3. Specify the External Collector’s IP address in the provided field.
4. For the Source IP to Use for Collector on a VPN Tunnel, specify the source IP if the external collector must be reached by a VPN tunnel. Note that this step is optional.
5. Specify the External Collector’s UDP port number in the provided field. The default port is 2055.
6. In the Connection Report Settings and Report Connections, select the Interface-based checkbox. Once enabled, the flows reported are based on the initiator or responder interface. Note that this step is optional.
7. In the Connection Report Settings and Report Connections, select the Firewall/App Rules-based checkbox. Once enabled, the flows reported are based on already existing firewall rules. Note that this step is optional, but is required if flow reporting is done on selected interfaces.
8. Note that Netflow version-9 uses templates that must be known to an external collector before sending data. In External Collector Settings and Actions, click the Generate ALL Templates button to begin generating templates.
IPFIX (NetFlow Version 10) Configuration Procedures
To configure IPFIX, or NetFlow version 10, flow reporting, follow the steps listed below.
1. In External Collector Settings, select the Send AppFlow and Real-Time Data To External Collector checkbox.
2. Select IPFIX as the External Flow Reporting Format from the drop-down list.
3. Specify the External Collector’s IP address in the provided field.
4. For the Source IP to Use for Collector on a VPN Tunnel, specify the source IP if the external collector must be reached by a VPN tunnel. Note that this step is optional.
5. Specify the External Collector’s UDP port number in the provided field. The default port is 2055.
6. In the Connection Report Settings and Report Connections, select the Interface-based checkbox. Once enabled, the flows reported are based on the initiator or responder interface. Note that this step is optional.
7. In the Connection Report Settings and Report Connections, select the Firewall/App Rules-based checkbox. Once enabled, the flows reported are based on already existing firewall rules. Note that this step is optional, but is required if flow reporting is done on selected interfaces.
8. Note that IPFIX uses templates that must be known to an external collector before sending data. In External Collector Settings and Actions, click the Generate ALL Templates button to begin generating templates.
IPFIX with Extensions Configuration Procedures
To configure IPFIX with extensions flow reporting, follow the steps listed below.
1. In External Collector Settings, select the Send AppFlow and Real-Time Data To External Collector checkbox.
2. Select IPFIX with extensions as the External Flow Reporting Format from the drop-down list.
3. Specify the External Collector’s IP address in the provided field.
4. For the Source IP to Use for Collector on a VPN Tunnel, specify the source IP if the external collector must be reached by a VPN tunnel.
5. Specify the External Collector’s UDP port number in the provided field. The default port is 2055.
6. In the Connection Report Settings and Report Connections, select the Interface-based checkbox. Once enabled, the flows reported are based on the initiator or responder interface. Note that this step is optional.
7. In the Connection Report Settings and Report Connections, select the Firewall/App Rules-based checkbox. Once enabled, the flows reported are based on already existing firewall rules. Note that this step is optional, but is required if flow reporting is done on selected interfaces.
8. Note that IPFIX uses templates that must be known to an external collector before sending data. Click the Generate ALL Templates button to begin generating templates.
Enable the option to Send static flows at regular intervals by selecting the checkbox. After enabling this option, click the Generate Static Flows button.
10. Select the tables you wish to receive static flows for from the Send Static AppFlow For Following Tables drop-down list.
11. Select the tables you wish to receive dynamic flows for from the Send Dynamic AppFlow For Following Tables drop-down list.
Select any additional reports to be generated to a flow from the Include Following Additional Reports via IPFIX drop-down list.
Configuring Netflow with Extensions with SonicWALL Scrutinizer
One external flow reporting option that works with Netflow with Extensions is the third-party collector called SonicWALL Scrutinizer. This collector displays a range of reporting and analysis that is both Netflow and SonicWALL flow aware.
To verify your Netflow with Extensions reporting configurations, perform the following steps.
1. In Visualization Dashboard Settings and Collector To User For AppFlow Monitor Page, select the AppFlow Server checkbox.
2. In AppFlow Server Settings, enable the Send AppFlow To SonicWALL AppFlow Server checkbox to enable flows to be reported to an external flow collector.
3. In External Collector Settings, select the Send AppFlow and Real-Time Data To External Collector checkbox.
4. Select IPFIX with extensions as the External Flow Reporting Format from the drop-down list.
5. Specify the External Collector’s IP address in the provided field.
6. For the Source IP to Use for Collector on a VPN Tunnel, specify the source IP if the external collector must be reached by a VPN tunnel.
7. Specify the External Collector’s UDP port number in the provided field. The default port is 2055.
8. In the Connection Report Settings and Report Connections, select the Interface-based checkbox. Once enabled, the flows reported are based on the initiator or responder interface. Note that this step is optional.
9. In the Connection Report Settings and Report Connections, select the Firewall/App Rules-based checkbox. Once enabled, the flows reported are based on already existing firewall rules. Note that this step is optional, but is required if flow reporting is done on selected interfaces.
10. Select the tables you wish to receive static flows for from the provided drop-down list. Then, click Accept.
Currently, Scrutinizer supports Applications and Threats only. Future versions of Plixer will support the following Static Flows: Location Map, Services, Rating Map, Table Map, and Column Map.
11. Next, navigate to the Network > Interfaces screen.
12. Confirm that Flow Reporting is enabled per interface by clicking the Configure icon of the interface you are requesting data from.
13. On the Advanced tab, select the checkbox to Enable flow reporting. Then, click OK.
14. Login to SonicWALL Scrutinizer. The data displays within minutes.
The following section describes the various NetFlow tables. Also, this section describes in detail the IPFX with extensions tables that are exported when the SonicWALL is configured to report flows.
This section includes the following sub-sections:
Static Tables are tables with data that does not change over time. However, this data is required to correlate with other tables. Static tables are usually reported at a specified interval, but may also be configured to send just once. The following is a list of Static IPFIX tables that may be exported:
• Applications Map—This table reports all applications the Dell SonicWALL network security appliance identifies, including various Attributes, Signature IDs, App IDs, Category Names, and Category IDs.
• Viruses Map—This table reports all viruses detected by the Dell SonicWALL network security appliance.
• Spyware Map—This table reports all spyware detected by the Dell SonicWALL network security appliance.
• Intrusions Map—This table reports all intrusions detected by the Dell SonicWALL network security appliance.
• Location Map—This table represents SonicWALL’s location map describing the list of countries and regions with their IDs.
• Services Map—This table represents SonicWALL’s list of Services with Port Numbers, Protocol Type, Range of Port Numbers, and Names.
• Rating Map—This table represents SonicWALL’s list of Rating IDs and the Name of the Rating Type.
• Table Layout Map—This table reports SonicWALL’s list of tables to be exported, including Table ID and Table Names.
• Column Map—This table represents SonicWALL’s list of columns to be reported with Name, Type Size, and IPFIX Standard Equivalents for each column of every table.
Unlike Static tables, the data of Dynamic tables change over time and are sent repeatedly, based on the activity of the Dell SonicWALL network security appliance. The columns of these tables grow over time, with the exception of a few tables containing statistics or utilization reports. The following is a list of Dynamic IPFIX tables that may be exported:
• Connections—This table reports SonicWALL connections. The same flow tables can be reported multiple times by configuring triggers.
• Users—This table reports users logging in to the Dell SonicWALL network security appliance via LDAP/RADIUS, Local, or SSO.
• URLs—This table reports URLs accessed through the Dell SonicWALL network security appliance.
• URL ratings—This table reports Rating IDs for all URLs accessed through the Dell SonicWALL network security appliance.
• VPNs—This table reports all VPN tunnels established through the Dell SonicWALL network security appliance.
• Devices—This table reports the list of all devices connected through the Dell SonicWALL network security appliance, including the MAC addresses, IP addresses, Interface, and NETBIOS name of connected devices.
• SPAMs—This table reports all email exchanges through the SPAM service.
• Locations—This table reports the Locations and Domain Names of an IP address.
• VoIPs—This table reports all VoIP/H323 calls through the Dell SonicWALL network security appliance.
The following section shows examples of the type of Netflow template tables that are exported. You can perform a Diagnostic Report of your own Netflow Configuration by navigating to the System > Diagnostics screen, and click the Download Report button in the “Tech Support Report” section.
The NetFlow version 5 datagram consists of a header and one or more flow records, using UDP to send export datagrams. The first field of the header contains the version number of the export datagram. The second field in the header contains the number of records in the datagram, which can be used to search through the records. Because NetFlow version 5 is a fixed datagram, no templates are available, and will follow the format of the tables listed below.
|
NetFlow Version 5 Header Format
|
NetFlow Version 5 Flow Record Format
An example of a NetFlow version 9 template is displayed below.
The following table details the NetFlow version 9 Template FlowSet Field Descriptions.
|
An example of an IPFIX (NetFlow version 10) template.
The following table details the IPFIX Template FlowSet Field Descriptions.
|
IPFIX with extensions exports templates that are a combination of NetFlow fields from the aforementioned versions and SonicWALL IDs. These flows contain several extensions, such as Enterprise-defined field types and Enterprise IDs. Note that the SonicWALL Specific Enterprise ID (EntID) is defined as 8741.
The following Name Template is a standard for the IPFIX with extensions templates. The values specified are static and correlate to the Table Name of all the NetFlow exportable templates.
The following template is an example of an IPFIX with extensions template.
This section describes how to configure a SonicWALL AppFlow Server as an external collector for AppFlow and real-time data reporting and analysis. Network administrators can configure a central AppFlow Server to support multiple SonicWALL SuperMassives.
This section includes the following subsections:
• Configuring AppFlow Server Settings
• Verifying AppFlow Server Configuration
Configuring AppFlow Server Settings
To configure an AppFlow Server, perform the following steps:
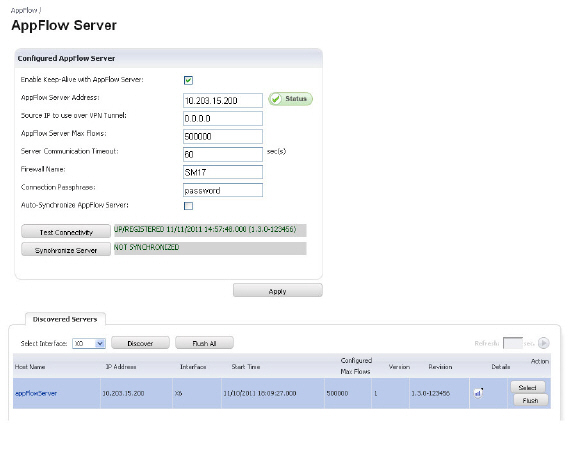
1. Navigate to the AppFlow > AppFlow Server page. To automatically retrieve status updates on your AppFlow server, select the Enable Keep-Alive with AppFlow Server checkbox.
2. In the AppFlow Server Address field, enter the IP address.
3. In the Source IP to use over VPN Tunnel field, enter the IP address reachable through a VPN tunnel.
4. In the AppFlow Server Max Flows field, enter the maximum number of flows stored in a single database file.
5. In the Sever Communication Timeout field, enter the number of seconds to wait to receive a response from the AppFlow server for AppFlow Monitor data. The range accepted are between 60 to 180 seconds.
6. Enter the name of your SonicWALL SuperMassive. This name must be unique if more than on SonicWALL SuperMassive device is used with a single AppFlow server.
7. In the Connection Passphrase field, enter the password for your AppFlow Server to respond to the SonicWALL SuperMassive.
8. Select the Auto-Synchronize AppFlow Server checkbox. This will enable the SonicWALL SuperMassive to send static flows to the AppFlow Server each time the SonicWALL SuperMassive is rebooted.
9. Click the Test Connectivity button. This starts a “hello” packet transmission to the AppFlow Server. If the AppFlow Server responds, a green status message displays “Up.” If the SonicWALL SuperMassive is registered on mysonicwall.com, a green status message displays “Registered.” And a time stamp is displayed when the last time the SonicWALL SuperMassive sent a “hello” packet and received an acknowledged “hello” packet back from the AppFlow Server.
10. Click the Synchronize Server button. The SonicWALL SuperMassive will start sending static flows to the AppFlow Server.
11. In the Server Discovery section, the Start Discovery button displays all the AppFlow Servers directly connected to your SonicWALL SuperMassive device. In the Action column, click the Select button to auto-fill AppFlow Server IP address and settings information as the selected AppFlow Server for your SonicWALL SuperMassive device. The Flush All and Flush buttons clears the discovery list.
Verifying AppFlow Server Configuration
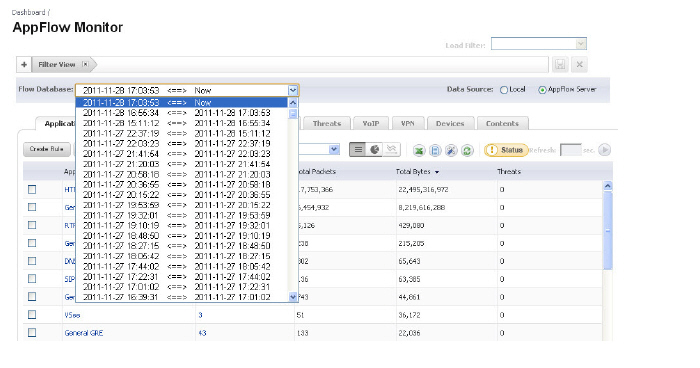
Verify your SonicWALL SuperMassive is using the AppFlow Server data by navigating to the AppFlow Monitor or Real-Time Monitor pages. At the top of the page next to the Data Source selection, the AppFlow Server radio button is selected and you can select from the Flow Database pull-down menu the available database flow files to display.
Deploying an External Collector AppFlow Server
This section describes installation, multiple administrator login, and configuring an external appflow server to support aggregate and individual unit reporting for multiple SonicWALL Supermassives.
This section includes the following subsections:
• Installing the SonicWALL AppFlow Server Software Client
• Configuring the SonicWALL AppFlow Server Settings
• Adding Multiple Administrators to the SonicWALL AppFlow Server
Installing the SonicWALL AppFlow Server Software Client
The SonicWALL AppFlow Server Software Client is available for download on MySonicWALL.com in the Software Download Center. To download this software, you will need to create a MySonicWALL.com user account and complete the product registration process for your SonicWALL Supermassives.
Configuring the SonicWALL AppFlow Server Settings
After installing the SonicWALL AppFlow Server Software Client, login to your SonicWALL AppFlow Server. In the SonicWALL AppFlow Server management interface, you can configure the server settings, add devices and users for AppFlow reporting.
To provision the SonicWALL AppFlow server, perform the following steps:
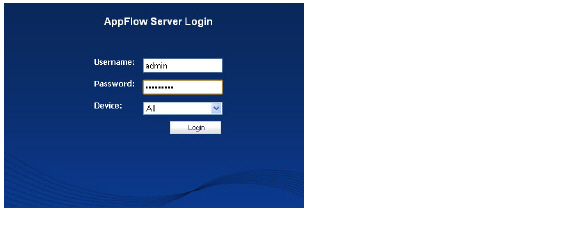
1. In a browser, enter the LAN IP address of your SonicWALL AppFlow server. The AppFlow Server Login window displays. Enter username and password. Upon initial login, the default username and password is admin and password.
2. Navigate to the System > Settings page. Enter the following UNIX server file directory path location details. The file directory paths listed below in italics are example file names and directory paths.
• Database File: /data/
• Serial File: /etc/appflow/<appflow.serial>
• Log File: /var/log/<appflow.log>
• Dump File: /var/log/<appflow.dump>
• User Log File: /var/log/<user.log>
3. Enter the following AppFlow Collector server settings.
• IPFIX UDP Port: <2055>
• Mirror UDP Port: <5055>
• Memory Pool Size: <500>
• Dump Period: <30>
• User Timeout: <599999>
• Max Users: <50>
Adding a Device for AppFlow Server Database Collection
To add a SonicWALL SuperMassive device, perform the following steps:
1. Navigate to the AppFlow > Devices page. Click the Add Device button. The Add Device pop-up window displays.
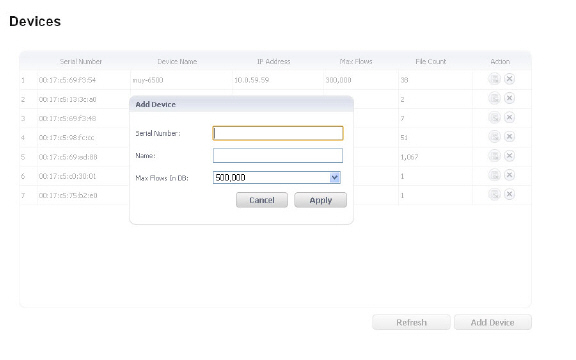
2. Enter the following information for your SonicWALL SuperMassive device:
• Serial Number: <00:17c5:72:g3:55>
• Name: Enter a friendly name for your SonicWALL SuperMassive.
• Max Flows in DB: Select from 5,000 to 1,000,000 flows.
3. To delete database files, in the Action column click the edit icon. Enter the file count to deleted database files for the respective SonicWALL SuperMassive device, and click the Apply button.
4. To remove a device, in the Action column click the remove icon. A pop-up warning dialog box displays to verify if you want to remove the selected device from the managed device list. Click the OK button to remove the device.
Adding Multiple Administrators to the SonicWALL AppFlow Server
This section provides procedures to add multiple users for AppFlow server administration. Similar to SonicOS multiple administrator settings, you can create user settings with the following user type restrictions:
• Login to administer and view Dashboard AppFlow reports for only a single device
• Login to only view aggregate Dashboard AppFlow reports for a group of SonicWALL SuperMassive devices
• Login with “Full Admin” privileges
To configure new users and set administrative privileges, perform the following steps:
This section is in progress.
Note For increased convenience and accessibility, the Real-Time Monitor page can be accessed either from Dashboard > Real-Time Monitor or AppFlow > Real-Time Monitor. The page is identical regardless of which tab it is accessed through. For information on using Real-Time Monitor, refer to Dashboard > Real-Time Monitor.
Note For increased convenience and accessibility, the AppFlow Monitor page can be accessed either from Dashboard > AppFlow Monitor or AppFlow > AppFlow Monitor. The page is identical regardless of which tab it is accessed through. For information on using AppFlow Monitor, refer to Dashboard > AppFlow Monitor.
Note For increased convenience and accessibility, the AppFlow Reports page can be accessed either from Dashboard > AppFlow Reports or AppFlow > AppFlow Reports. The page is identical regardless of which tab it is accessed through. For information on using AppFlow Reports, refer to Dashboard > AppFlow Reports.