AppFlow_Server
This section describes how to configure a SonicWALL AppFlow Server as an external collector for AppFlow and real-time data reporting and analysis. Network administrators can configure a central AppFlow Server to support multiple firewalls.
This section includes the following subsections:
• Configuring AppFlow Server Settings
• Verifying AppFlow Server Configuration
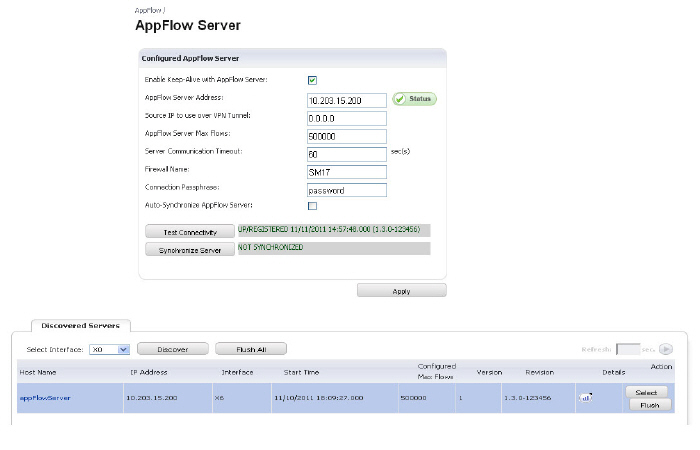
Configuring AppFlow Server Settings
To configure an AppFlow Server, perform the following steps:
1. Navigate to the AppFlow > AppFlow Server page. To automatically retrieve status updates on your AppFlow server, select the Enable Keep-Alive with AppFlow Server checkbox.
2. In the AppFlow Server Address field, enter the IP address.
3. In the Source IP to use over VPN Tunnel field, enter the IP address reachable through a VPN tunnel.
4. In the AppFlow Server Max Flows field, enter the maximum number of flows stored in a single database file.
5. In the Sever Communication Timeout field, enter the number of seconds to wait to receive a response from the AppFlow server for AppFlow Monitor data. The range accepted are between 60 to 180 seconds.
6. Enter the name of your firewall. This name must be unique if more than on firewall device is used with a single AppFlow server.
7. In the Connection Passphrase field, enter the password for your AppFlow Server to respond to the firewall.
8. Select the Auto-Synchronize AppFlow Server checkbox. This will enable the firewall to send static flows to the AppFlow Server each time the firewall is rebooted.
9. Click the Test Connectivity button. This starts a “hello” packet transmission to the AppFlow Server. If the AppFlow Server responds, a green status message displays “Up.” If the firewall is registered on mysonicwall.com, a green status message displays “Registered.” And a time stamp is displayed when the last time the firewall sent a “hello” packet and received an acknowledged “hello” packet back from the AppFlow Server.
10. Click the Synchronize Server button. The firewall will start sending static flows to the AppFlow Server.
11. In the Server Discovery section, the Start Discovery button displays all the AppFlow Servers directly connected to your firewall device. In the Action column, click the Select button to auto-fill AppFlow Server IP address and settings information as the selected AppFlow Server for your firewall device. The Flush All and Flush buttons clears the discovery list.
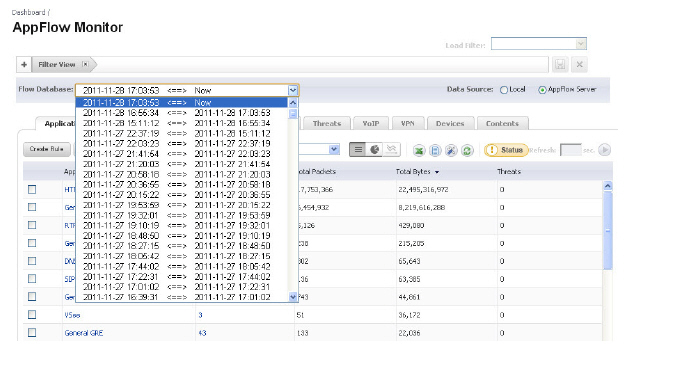
Verifying AppFlow Server Configuration
Verify your firewall is using the AppFlow Server data by navigating to the AppFlow Monitor or Real-Time Monitor pages. At the top of the page next to the Data Source selection, the AppFlow Server radio button is selected and you can select from the Flow Database pull-down menu the available database flow files to display.
Deploying an External Collector AppFlow Server
This section describes installation, multiple administrator login, and configuring an external appflow server to support aggregate and individual unit reporting for multiple firewalls.
This section includes the following subsections:
• Installing the SonicWALL AppFlow Server Software Client
• Configuring the SonicWALL AppFlow Server Settings
Installing the SonicWALL AppFlow Server Software Client
The SonicWALL AppFlow Server Software Client is available for download on MySonicWALL.com in the Software Download Center. To download this software, you will need to create a MySonicWALL.com user account and complete the product registration process for your firewalls.
Configuring the SonicWALL AppFlow Server Settings
After installing the SonicWALL AppFlow Server Software Client, login to your SonicWALL AppFlow Server. In the SonicWALL AppFlow Server management interface, you can configure the server settings, add devices and users for AppFlow reporting.
To provision the SonicWALL AppFlow server, perform the following steps:
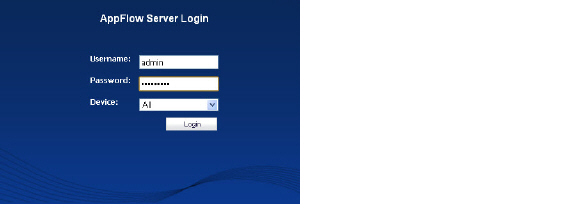
1. In a browser, enter the LAN IP address of your SonicWALL AppFlow server. The AppFlow Server Login window displays. Enter username and password. Upon initial login, the default username and password is admin and password.
2. Navigate to the System > Settings page. Enter the following UNIX server file directory path location details. The file directory paths listed below in italics are example file names and directory paths.
– Database File: /data/
– Serial File: /etc/appflow/<appflow.serial>
– Log File: /var/log/<appflow.log>
– Dump File: /var/log/<appflow.dump>
– User Log File: /var/log/<user.log>
3. Enter the following AppFlow Collector server settings.
– IPFIX UDP Port: <2055>
– Mirror UDP Port: <5055>
– Memory Pool Size: <500>
– Dump Period: <30>
– User Timeout: <599999>
– Max Users: <50>
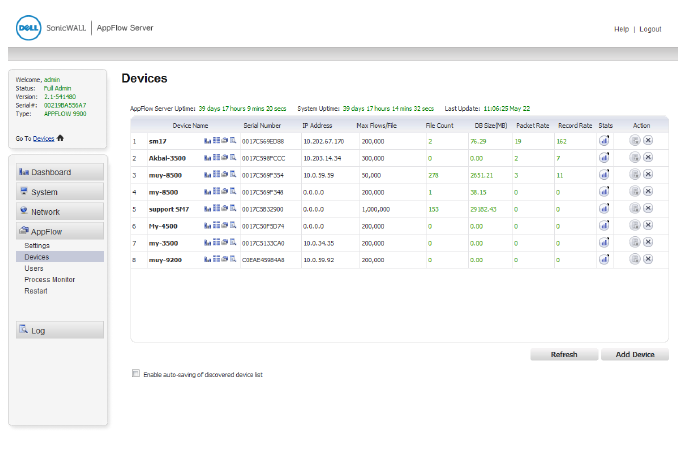
Adding a Device for AppFlow Server Database Collection
To add a firewall device, perform the following steps:
1. Navigate to the AppFlow > Devices page. Click the Add Device button. The Add Device pop-up window displays.

2. Enter the following information for your firewall device:
– Serial Number: <00:17c5:72:g3:55>
– Name: Enter a friendly name for your firewall.
– Max Flows in DB: Select from 5,000 to 1,000,000 flows.
3. To delete database files, in the Action column click the edit icon. Enter the file count to deleted database files for the respective firewall, and click the Apply button.
4. To remove a device, in the Action column click the remove icon. A pop-up warning dialog box displays to verify if you want to remove the selected device from the managed device list. Click the OK button to remove the device.
Viewing the AppFlow Monitors from an AppFlow Server
The Dashboard/AppFlow monitors that can be accessed from the Dashboard page or the AppFlow page can also be accessed and viewed from an Appflow Server.
You can view the following AppFlow/Dashboard monitors from an AppFlow Server:
• Real-Time Monitor
• AppFlow Dash
• AppFlow Monitor
• AppFlow Reports
From the AppFlow Devices menu, you can add a device to monitor. After you add devices, you can choose any of those devices from the list of devices in the table.
To add a device to the AppFlow Server Devices page:
1. Click the Add Device button.
The Add Device dialog appears.
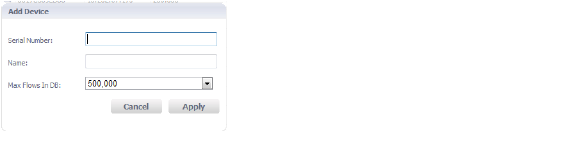
2. In the Serial Number box, enter the serial number of the device you want to add.
3. In the Name box, enter a name for your device.
4. From the Max flows In DB menu, select the value you want.
Selectable values are 5,000 to 1,000,000.
5. Click Apply.
Each device in the Devices table has four icons that you can click to launch the Real-Time Monitor, AppFlow Dash, AppFlow Monitor, or AppFlow Reports.
At the top left, the Welcome, Status, Version, Serial#, Type, and Device selection menu are displayed.
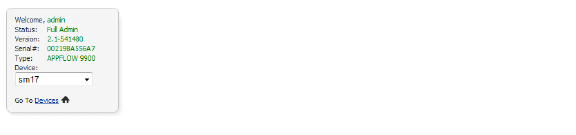
To show external collection data in any the monitors:
• From the Device menu, select the device you want.
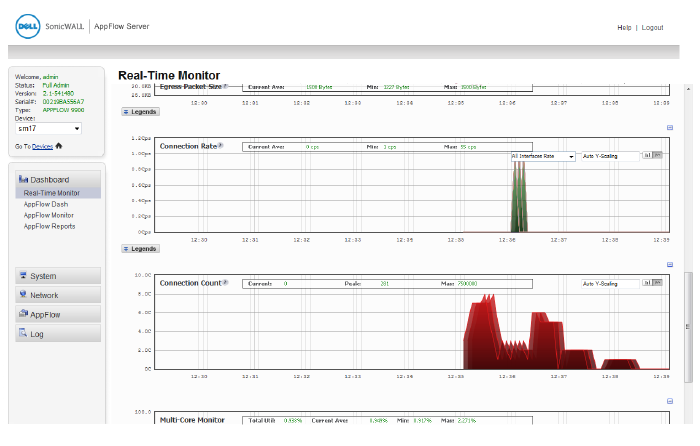
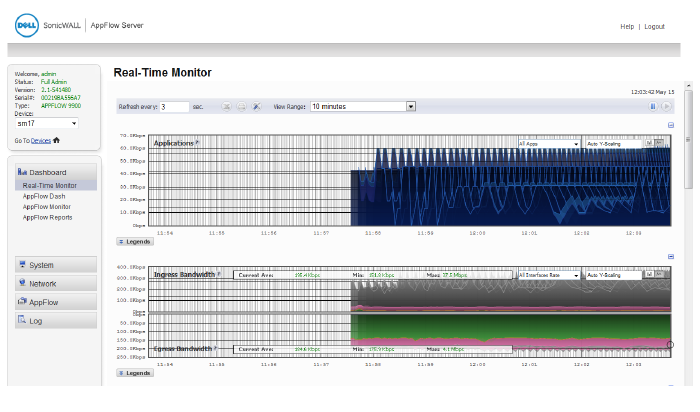
Real-Time Monitor
The three graphics that follow show the Real-Time Monitor graphs as they appear in the AppFlow Server. The first two monitors at the top of the Real-Time Monitor page are the Connection Rate and Connection Count monitors.
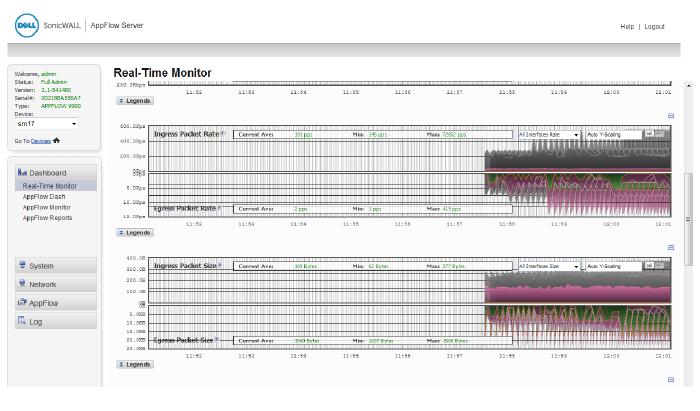
As you scroll down the Real-Time Monitor page, you can view the Packet Rate and Packet Size monitors.
As you scroll further, you can view the Applications monitor and the Bandwidth monitor.
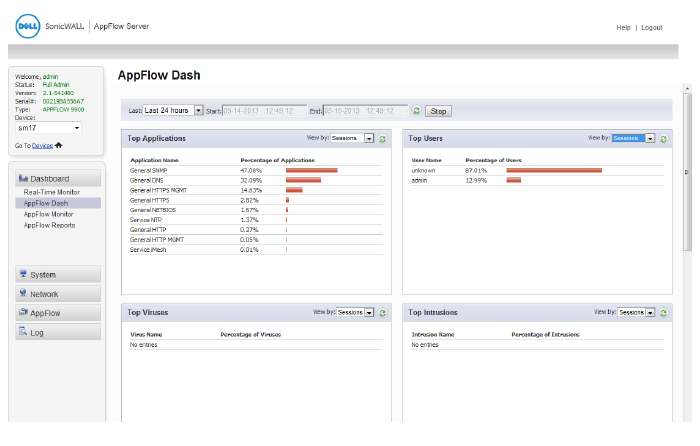
AppFlow Dash
The AppFlow Dash page as viewed from the AppFlow Server displays the same tables as seen on the Dashboard page or the AppFlow page.
AppFlow Monitor
The AppFlow Monitor page as viewed from the AppFlow Server displays the same table as seen on the Dashboard page or the AppFlow page.
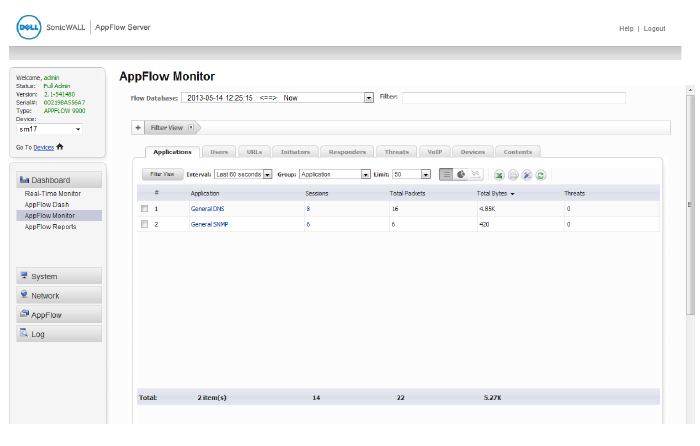
The AppFlow Monitor page has tabs that enable you to view and monitor the following types of items in separate tables:
• Applications
• Users
• IP
• Viruses
• Intrusions
• Spyware
• Location
• URL Rating
The following functional buttons and menus are in the row directly below the tabs row:
• Filter View button – Select an item in the table and click this button to filter the table view based on your selection.
• Interval menu – Select the refresh interval from this menu.
• Group menu – Select the group to show in the table from this menu.
• Limit menu – Select the number of entries to show in the table.
• Table View button – Click to display in table format.
• Pie Chart button – Click to display in pie chart format.
• Export button – Click to export reports to an external device.
• Print button – Click to print.
• Tools button – Click to select columns to display.
• Refresh button – Click to refresh the screen.
AppFlow Reports
The AppFlow Reports page has the same tabs, similar buttons, and similar menus as the AppFlow Monitor page.
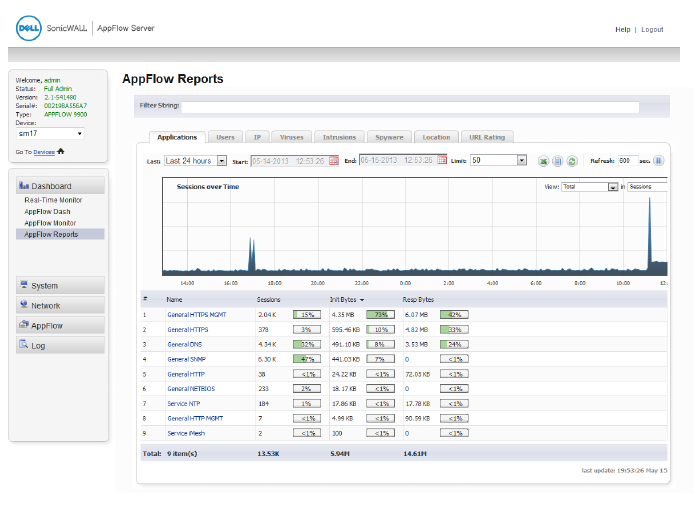
The AppFlow Reports page allows you to select two points on the graph, along the time axis, so that you can zoom in on a specific time period. When you click the Refresh button, the screen show a graph for just that time period.
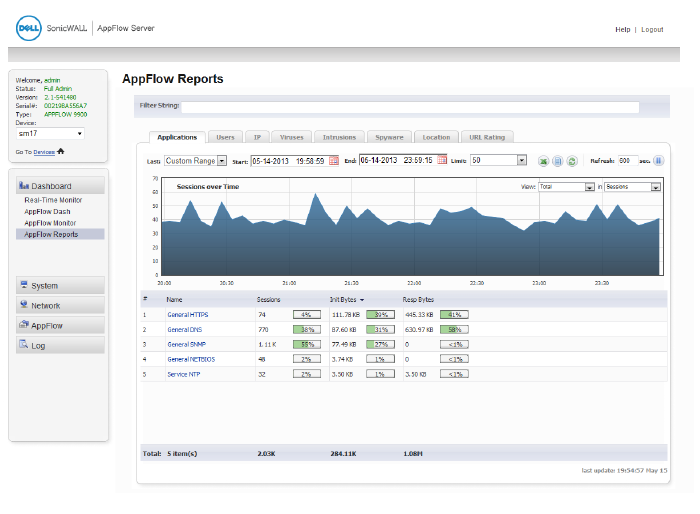
From the View in Sessions menus in the right side of the graph, you can select more granular views.
Note For increased convenience and accessibility, the Real-Time Monitor page can be accessed either from Dashboard > Real-Time Monitor or AppFlow > Real-Time Monitor. The page is identical regardless of which tab it is accessed through. For information on using Real-Time Monitor, refer to Dashboard > Real-Time Monitor.
Note For increased convenience and accessibility, the AppFlow Monitor page can be accessed either from Dashboard > AppFlow Dash or AppFlow > AppFlow Dash. The page is identical regardless of which tab it is accessed through. For information on using AppFlow Monitor, refer to Dashboard > AppFlow Dash.
Note For increased convenience and accessibility, the AppFlow Monitor page can be accessed either from Dashboard > AppFlow Monitor or AppFlow > AppFlow Monitor. The page is identical regardless of which tab it is accessed through. For information on using AppFlow Monitor, refer to the Dashboard > AppFlow Monitor.
Note For increased convenience and accessibility, the AppFlow Reports page can be accessed either from Dashboard > AppFlow Reports or AppFlow > AppFlow Reports. The page is identical regardless of which tab it is accessed through. For information on using AppFlow Reports, refer to the Dashboard > AppFlow Reports.