log_monitor
Log > Log Monitor
The Dell SonicWALL network security appliance maintains an Event log for tracking potential security threats. This log can be viewed in the Log > Log Monitor page or in the Dashboard > Log Monitor page. Both pages have identical functionality.

The event log can be sent automatically to an Email address for convenience and archiving. Alerts from the Log Monitor can also be sent via Email and can alert you about such things as attacks to your firewall. Alerts are immediately e-mailed, either to an e-mail address or to an e-mail pager. Each log entry contains the date and time of the event and a brief message describing the event.
The displayed information is controlled by setting options for which categories you want to display in the log table. Use the Categories column to determine the baseline events to monitor and to configure event-specific information.
The Filter input box at the top left corner of the Log Monitor panel enables you to enter a search string that is used to filter the log events that are displayed in Log Monitor panel.

You can type any substring and press the Enter key to filter the Log Monitor panel. The Log Monitor will list only log events that contain matches for that substring.
Configure Logging / View Logging
In the top right corner of the Log Monitor page, the Configure Logging button can be clicked to switch to the Log Settings page where you can configure the settings for logging events. When you are on the Log Settings page, the View Logging button can be clicked to switch to the Log Monitor page.
In the bottom right corner of the Log Monitor page, the time and date of the last update to the Log Monitor are displayed.
Note There are log messages that show the up/down status of some of the special network objects. These objects, however, live for only three seconds and then are deleted automatically.
Topics:
• Event Log Management
• Log Monitor Table Functions
Event Log Management
Some of the common tasks that you can perform to manage the Event Log are as follows:
• Online Viewing of Log Events—The Event Log is not persistent. Older events in the run-time Event Log database buffer may be over-written with newer events.
• Online Viewing Using the SonicOS Log Monitor UI—The UI takes snapshots of the Event Log database, so users can scroll forward and backwards in the Event Log using their browser.
• Text Viewing Format Using the CLI—Shows only the current content of the Event Log database.
• Log Monitor Display Filtering—You can customize the Log Event display.
• Log Settings Capture Filtering—You can customize the Log Event capture.
• Offline Viewing of Log Events—Offline viewing is persistent because the system saves the log events to an external source, such as your computer.
• Viewing Log Events via Email—Using your Email client, you can setup individual Email alerts that are sent whenever an event occurs, or an Email digest that sends batches of log events periodically.

• Viewing Log Events via Syslog Viewer—You can view and configure log events and capture settings using a Syslog viewer.
• Viewing Log Events via GMS Syslogs—You can view and configure log events using GMS.
• Exporting the Event Log Database—You can export the Event Log database as a plain text file by clicking the Export button.

• Deleting Entries from the Run-Time Event Log Database—You can permanently delete entries, using the Clear All button. So, proceed with caution. If automation is not enabled, export the database before using Clear All.

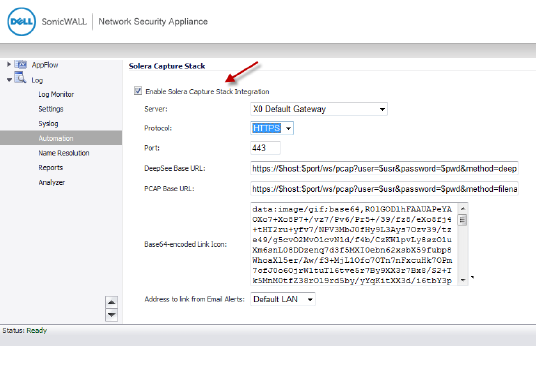
• Deep Packet Forensics using a Data Recorder such as Solera—You can record deep packet events using a data recorder such as Solera. This feature is enabled under Log > Automation and the events to record are configured under Log > Settings.

Log Monitor Table Functions
The Log Monitor table provides numerous settings to allow you to navigate, view, and export results. Table columns can be customized, so that you can view full data on any event, or only the data you need. Table entries can be sorted to display in either ascending or descending order.
You can sort the entries in the Log Monitor table by clicking on the column header. The entries are sorted by ascending or descending order. The arrow to the right of the column entry indicates the sorting status. A down arrow means ascending order. An up arrow indicates a descending order.
The top row of the Log Monitor table contains several functional items:

• Log Events Since Menu
• Functional Buttons
• Refresh Box
Log Events Since Menu
From the Log Events Since menu, you can select the time interval in which to view log events. Time intervals range from the last 30 minutes to the last 30 days, or all log events in the database.
Functional Buttons
The functional buttons perform various functions of the Log Monitor. Pausing your cursor over a button reveals the description of the button.

The following table describes the button functions:
|
Button
|
Function
|
Description
|

|
Export Log as CSV File
|
Clicking this button displays a dialog that allows you to open or save the log in Comma-separated value (CSV) format. This format is used for importing into Excel or other presentation development applications.
|

|
Export Log as Plain Text File
|
Clicking this button displays a dialog that allows you to save the log in Plain Text format. Two formats for Email can be configured on the Log > Automation page: Plain Text or HTML.
|

|
Select Columns to Display
|
Clicking this button displays a dialog that allows you to select the columns that you want to show in the Log Monitor table.
|

|
Force Refreshing
|
Clicking this button updates the information in the Log Monitor table.
|

|
Send Log to Email Address
|
Clicking this button sends all logs to the configured email address.
|

|
Clear All Logs
|
Clicking this button deletes all saved logs.
|

|
Status
|
Clicking this button displays the total number of logs present in the database, as well as the latest reported time for each status category.
|
|
Refresh box
At the far right of the table, in the Refresh box, you can specify how often the Log Monitor table is updated with events from the event log database. The default is to refresh every 60 seconds, but other intervals can be specified. To refresh all output immediately, click the pause/play toggle button to the right of the Refresh box.

The pause/play toggle button starts or stops the Log Monitor table from updating its content. This is useful in cases where the Log Monitor table is very busy and is being updated continually in quick succession. Users can pause the screen from updating long enough to inspect the messages.
The Log Monitor is displayed in a table and can be sorted by column.
To select which columns you want to appear in the table.
1. Click the Tools button.

The Select Columns to Display dialog appears.

2. From the Select Columns to Display dialog, select the columns that you want to display.
3. Click Apply.
The default log table columns include:
• Time - The date and time of the event.
• ID - Identifying number for the event. ID is most useful when using GMS or Syslog. The ID is shown in Syslog packets and is used to identify data in generated reports.
• Category - To make it easier to find and configure the settings for an event, events can be displayed by Category, Group, or Event, as selected from the Select Columns to Display dialog.
• Priority - The level of priority associated with your log event. Syslog uses eight priorities to characterize messages: Emergency, Alert, Critical, Error, Warning, Notice, Informational, and Debug.
• Src. Int - Displays source network and IP address.
• Dst. Int - Displays the destination network and IP address.
• Src. IP - Displays the source IP address.
• Src. Port - Displays the source port.
• Dst. IP - Displays the destination IP address.
• Dst. Port - Displays the destination port.
• IP Protocol - The IP protocol (TCP or IP) in use
• User Name - Displays the name of the originating user
• Application - Displays the application accessing the network.
• Notes - Provides dynamic, detailed information about the event.
• Message - Provides a general description of the event.
Note The Time, ID, and Message columns are always displayed and cannot be hidden by customization.
Note For more information on specific log events, refer to the SonicOS Log Event Reference Guide.
Filtering the Log Monitor Table
The filter bar allows you to filter the log table based on selected criteria.
1. Select a filter item by clicking on the desired column cell. The selected cell turns blue. Multiple cells can be selected.
When finished making selections, click the + in the filter bar.
The filter criteria is applied to the display, and you see the filter type in the filter bar.
3. Click on the arrow  , beside the column name (in this case Category), to view the filter value.
4. To remove a filter, click the x next to the Filter type.
Filter View
Filter View allows you to set the filtering without any existing matches in the Log Monitor table.
In normal view, you can only set filtering based on an existing event that you can select in the Log Monitor table. In Filter View, you can select only one combination of Category/Priority at a time. In normal view, you can select several categories at the same time.
You can configure multiple filter views for categories using the filter bar.
To configure a filter view:
1. Go to the Log > Monitor page.
2. Click the + sign next to the Filter View bar. The Filter View dialog appears.

3. From the Priority menu, select the priority that you want.
4. From the Category menu, select the category that you want.
5. From the Source Interface menu, select the interface that you want.
6. From the Destination Interface menu, select the interface that you want.
7. In the Source IP box, enter the IP address of the source interface.
8. In the Destination IP box, enter the IP address of the destination interface.
9. Click Apply. The Log Monitor table displays the filtered results.
Log Event Messages
For a complete reference guide of log event messages, refer to the SonicOS Log Event Reference Guide at www.sonicwall.com/support.html.
Log Persistence
Lower end TZ models can store up to 800 event entries in the log buffer. All other Dell/Dell SonicWALL Release 6.2 models can store 1000 to 10,000 event entries in the log buffer.
When the log becomes full, one or a couple of the oldest log entries are deleted. You can also click the Clear all logs button to clear all log entries.
Emailing provides a simple version of logging persistence, while GMS provides a more reliable and scalable method.
By offering the administrator the option to deliver logs as either plain-text or HTML, the administrator has an easy method to review and replay events logged.
GMS
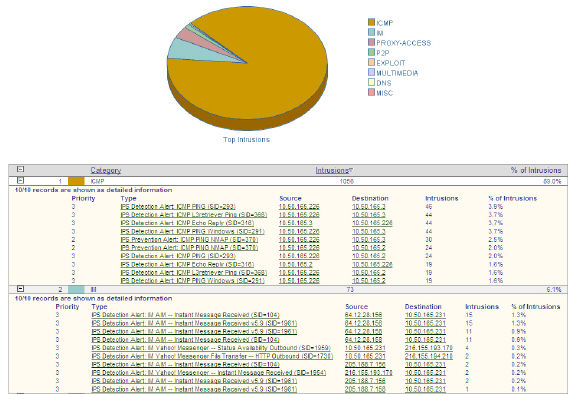
To provide the ability to identify and view events across an entire enterprise, a GMS update will be required. Device-specific interesting-content events at the GMS console appear in Reports > Log Viewer Search page, but are also found throughout the various reports, such as Top Intrusions Over Time.


