 button. The following graphic shows the Dashboard view:
Monitor_Tools_NetMonitor_Snwls
The Dell SonicWALL GMS Net Monitor periodically tests the status of SonicWALL appliances and other network devices. Once configured, it enables you to monitor the status of your network and immediately respond when SonicWALL appliances and other network devices become unavailable.
The Net Monitor enables you to categorize different groups of SonicWALL appliances or other network devices. You can categorize them by device type, geography, or any other organizational scheme. Additionally, you can assign devices within each category a high, medium, or low priority.
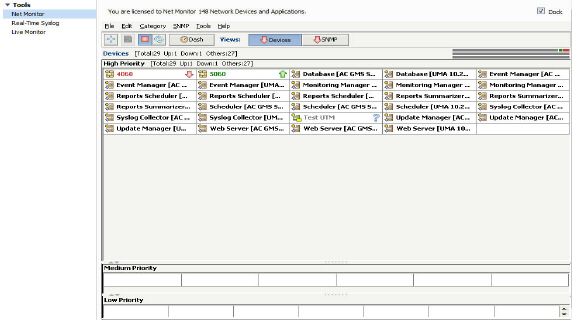
The following graphic shows the main Net Monitor page:
When you add a new device to your monitor, you will be able to select a category, priority level, how often the device is tested, and the type of test that is used. The Net Monitor currently supports five types of tests: Ping, TCP Probe, HTTP, HTTPS, and SNMP.
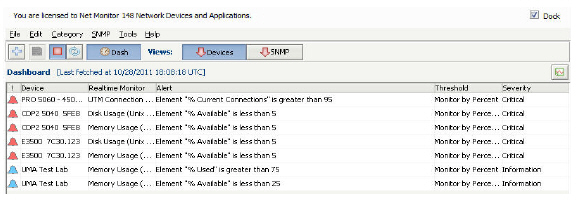
You can toggle between the main view of the Net Monitor page and the Dashboard view by clicking the button. The following graphic shows the Dashboard view:
This section contains the following subsections:
• Navigating the Net Monitor UI
The above graphic shows the main page of the Net Monitor in which there are High, Medium and Low priority devices. To switch between categories, click a category tab. To reconfigure the settings for a device, right-click the device and select Properties.
The Status Display shows the status of all devices within the category. If all devices are reachable, all three displays will be green.
To change the priority for a device, drag and drop its icon to a new Priority Category. To move a device between categories, drag its icon to the tab of the new category and drop it in the appropriate Priority Category.
GMS NetMonitor gives you the ability to search for devices using the Find feature:
1. In the menu bar, go to Edit > Find. The Find window displays.
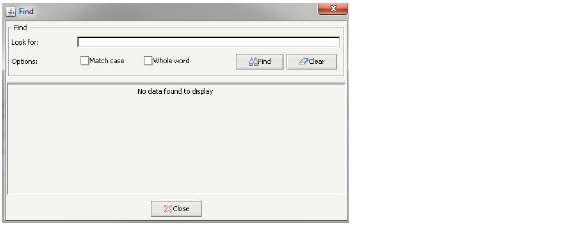
2. Type a search string in the Look For field.
3. You can optionally choose to Match case or to find only the Whole word in your search.
4. Click the Find button to search all views for your search term, results are displayed below.
5. Double click on the device you wish to display and it will be found highlighted in the NetMonitor window.
Note After making an initial search, you can use F3 (find next) and Shift+F3 (find previous) to move easily between found devices without having to keep the Find window open.
GMS NetMonitor provides the ability to view device status for all monitored devices:
1. In the NetMonitor window, select the device(s) you wish to view device status for.
2. In the menu bar, go to Tools > Status.
3. The Device Status window displays device specific attributes.
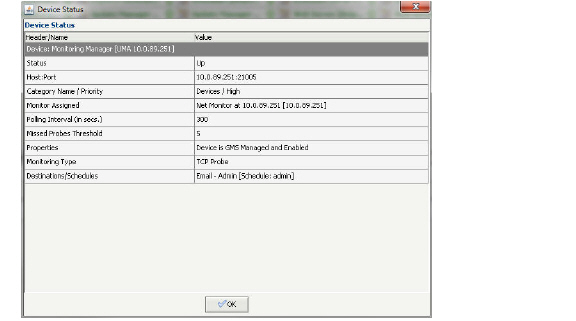
Note: Multiple Device Status windows may be opened simultaneously.
To configure Net Monitor preferences, perform the following steps:
1. In the NetMonitor window, select Preferences from the Tools Menu.
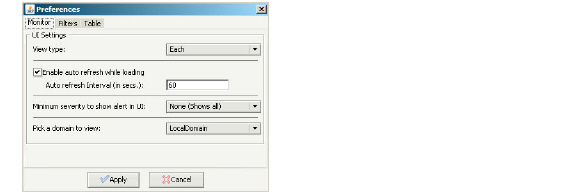
2. To view each category on its own page, select Each from the View Type list box. To view all categories on one page, select All.
3. To configure the Net Monitor to automatically refresh the status of monitored devices, select the Enable auto refresh while loading check box and specify the refresh interval.
4. In the Monitor tab of the Preferences window, select a Minimum Severity to Show Alert in Dashboard from the pull-down menu.
5. Pick a domain to view by selecting from the pull-down list. Note that this field is applicable only to the users with Super Admin access, and must be selected from this dialog box in order to view devices in other domains. Users without Super Admin access are only able to view devices in their own domain.
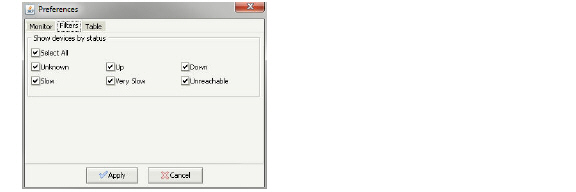
6. In the Filters tab, select which devices will be displayed in the Show devices by status area. To view all devices, select the Select All check box.
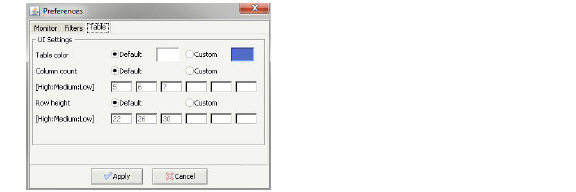
7. In the Table tab, select Default to view the default table color. To pick a custom color, select Custom and choose a color from the color selector.
8. Specify the Column count and Row height to display for each priority.
9. When you are finished, click Apply. To cancel and start over, click Cancel.
Managing Categories and Devices on the Net Monitor
This section contains the following subsections:
To create a new category, perform the following steps:
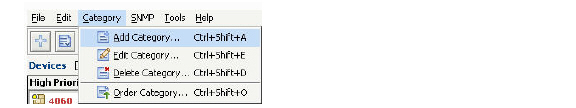
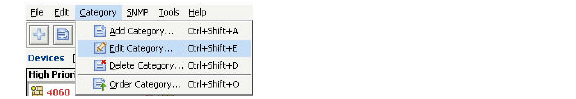
1. From the Net Monitor main page, select Add Category from the Category Menu.
2. The Add Category screen displays. Enter the name of the new category in the Name field.
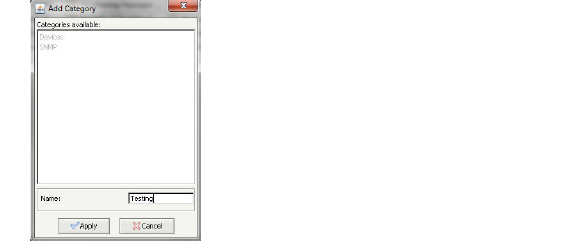
3. When you are finished, click Apply. To cancel and start over, click Cancel.
4. Repeat this procedure for each category to add. This new category will appear in the main toolbar of the Net Monitor page.

To edit an existing category, perform the following steps:
1. From the Net Monitor main page, select Edit Category from the Category Menu.
2. Select the category name you want to change from the list.
3. Enter a new name for the selected category in the Name field.
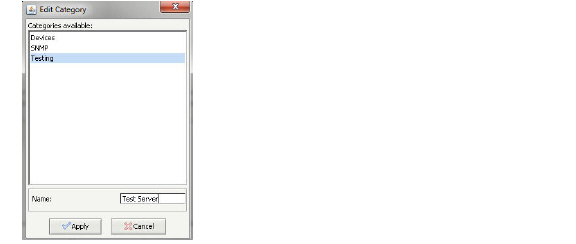
4. When you are finished, click Apply. To cancel and start over, click Cancel.
To delete an existing category, perform the following steps:
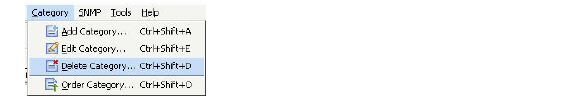
1. From the Net Monitor main page, select Delete Category from the Categories Menu.
2. From the list provided, select the category name (shift-click for multiple category names) you want to delete.
3. Select the Forcibly delete all devices under category checkbox to delete all devices in this category.
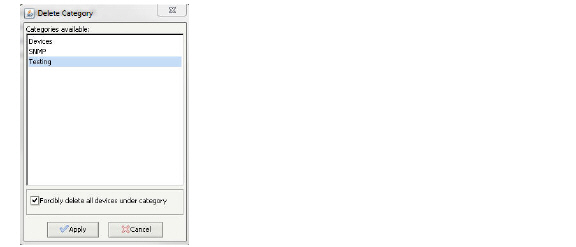
Note A warning message displays when selecting the Forcibly delete all devices under category checkbox. Click Yes to continue and delete this category.
4. To submit the delete request, click Apply. To cancel and start over, click Cancel.
To change the order of an existing category, perform the following steps:
1. Fro
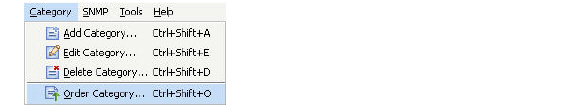
m the Net Monitor main page, select Order Category from the Category Menu.
2. From the list provided, select the category name you want to move.
3. Click the Move Up or Move Down buttons to change the order of this category.
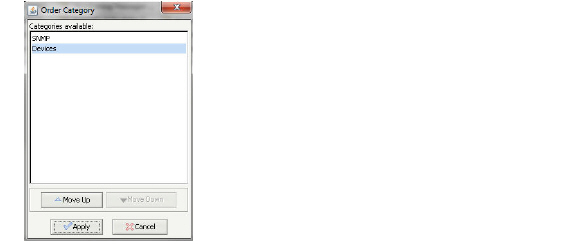
4. Click Apply to finish. To cancel and start over, click Cancel.
To add one or more SonicWALL appliances, perform the following steps:
1.
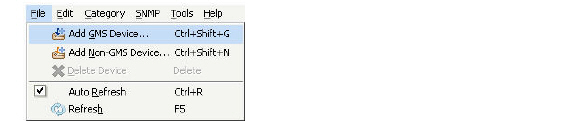
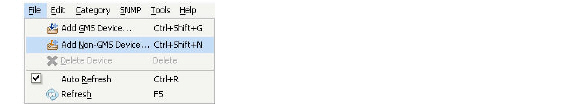
From the Net Monitor page, select Add GMS Device from the File Menu.
2. Select a device or group to monitor and click the Add button in the center of the screen. Repeat this step for each device or group to monitor.

3. Click Next. The second page of the Add GMS Device Wizard appears.
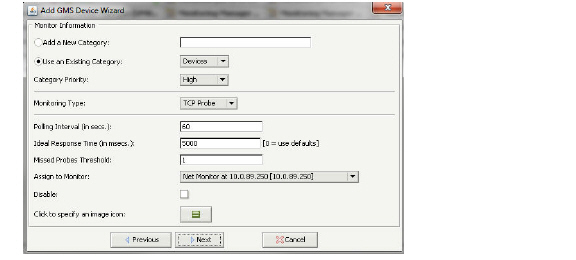
4. Select the category to which the SonicWALL appliance(s) will be added from the Use an Existing Category list box. To add the SonicWALL appliance(s) to a new category, enter the category name in the Add a New Category field.
5. Select the priority of the appliance(s) from the Category Priority list box.
6. Select how the SonicWALL appliance(s) will be monitored from the Monitoring Type list box and specify a Port if applicable.
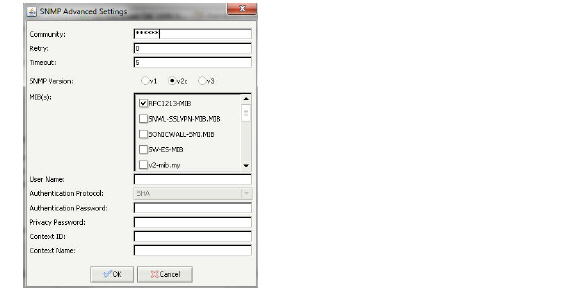
If choosing SNMP as the monitoring type, you must enter a Monitor Port. Configure the following advanced settings by clicking on the Advanced button.

|
Note Use extra caution when specifying the Retry and Timeout values, as the SNMP follows the “Exponential Back Off” algorithm to calculate the retry and timeout values. With this algorithm, the specified Timeout value increases exponentially with the retry value.
7. Press the OK button to save SNMP advanced settings.
8. Specify how often the SonicWALL appliance(s) will be tested in the Polling Interval field.
9. Enter the ideal response time (IRT) in the Ideal Response Time field (default: 500 milliseconds). SonicWALL appliances that take between 1 and 1.5 times the IRT will be marked as Slow. SonicWALL appliances that take between 1.5 and 2 times the IRT will be marked as Very Slow.
10. Select the Agent that will perform the testing from the Assign to Monitor list box.
11. Optional. To disable monitoring of the SonicWALL appliance(s), select Disable.
12. To change the icon image that will represent the device(s), click the icon image button and select a new image.
13. Click Next to continue.
If you did not configure the Monitoring Type as SNMP, the Assign Privileges page will display. See Step 14.
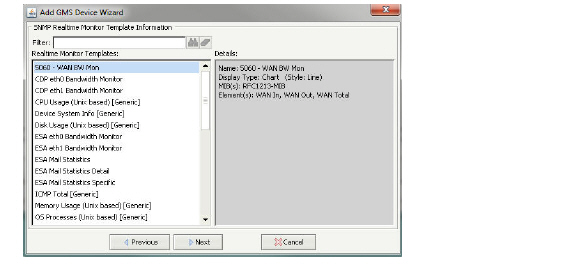
If you configured the Monitoring Type as SNMP, the SNMP Realtime Monitor Template Information page will display. Select the Realtime Monitor Template to apply to this device. Then, click Next.
Note Multiple templates can be selected by holding Ctrl + selecting the templates. The Filter search bar allows you to narrow the list of templates. Perform an exact match search by using double quotation marks, for example “template name”, or search with no quotation marks to search through multiple keywords.
14. On the Assign Privileges page, select users to have read-write privileges.
Note Multiple users can be selected by holding Ctrl + selecting the users. Permissions can be assigned to both Users and Usertypes.
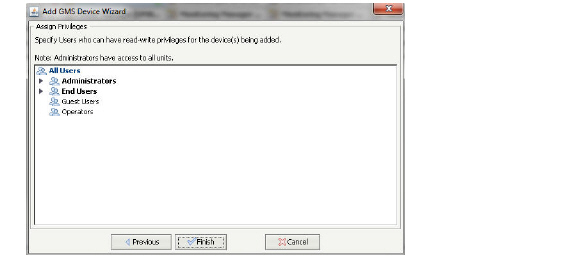
15. Click the Finish button to acquire the new device.
Note: The process of acquiring a new device may take several minutes. To force acquisition of the device, select the device and go to SNMP > SNMP Re-acquire in the NetMonitor menu bar.
* Custom MIBs may be required for some devices. Custom MIBs allow polling Non-SonicWALL or Non-Standard based SNMP enabled devices and to poll information specific to a certain device based on Manufacturer ID.These MIBs have to be placed in the etc\mibs folder by the GMS Administrator on the Web Server and Monitoring Agent machine(s) in order to use it for probing.
In addition to SonicWALL appliances, Dell SonicWALL GMS can monitor any publicly accessible servers or devices on the Internet. To add one or more non-SonicWALL devices, perform the following steps:
1. From the Net Monitor screen, select Add Non-GMS Device from the File Menu.
2. Enter a name for the device in the Name field and its IP address or hostname in the Host field and click Add. Repeat this step for each device to monitor.
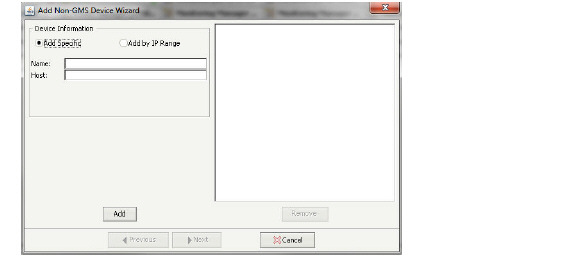
3. Click Next. The second page of the Add Non-GMS Device Wizard displays.

4. Select the category to which the device(s) will be added from the Use an Existing Category list box. To add the device to a new category, enter the category name in the Add a New Category field.
5. Select the priority of the device(s) from the Category Priority list box.
6. Select how the SonicWALL appliance(s) will be monitored from the Monitoring Type list box and specify a Port if applicable.
If choosing SNMP as the monitoring type, you must enter a Monitor Port. Configure the following advanced settings by clicking on the Advanced button.
|
Note Use extra caution when specifying the Retry and Timeout values, as the SNMP follows the “Exponential Back Off” algorithm to calculate the retry and timeout values. With this algorithm, the specified Timeout value increases exponentially with the retry value.
7. Press the OK button to save SNMP advanced settings.
8. Specify how often the SonicWALL appliance(s) will be tested in the Polling Interval field.
9. Enter the ideal response time (IRT) in the Ideal Response Time field (default: 500 milliseconds). SonicWALL appliances that take between 1 and 1.5 times the IRT will be marked as Slow. SonicWALL appliances that take between 1.5 and 2 times the IRT will be marked as Very Slow.
10. Select the Agent that will perform the testing from the Assign to Monitor list box.
11. Optional. To disable monitoring of the SonicWALL appliance(s), select Disable.
12. To change the icon image that will represent the device(s), click the icon image button and select a new image.
13. Click Next to continue.
If you did not configure the Monitoring Type as SNMP, the Assign Privileges page will display. See Step 14.
If you configured the Monitoring Type as SNMP, the SNMP Realtime Monitor Template Information page will display. Select the Realtime Monitor Template to apply to this device. Then, click Next.
Note Multiple templates can be selected by holding Ctrl + selecting the templates. The Filter search bar allows you to narrow the list of templates. Perform an exact match search by using double quotation marks, for example “template name”, or search with no quotation marks to search through multiple keywords.

14. On the Assign Privileges page, select users to have read-write privileges.
Note Multiple users can be selected by holding Ctrl + selecting the users. Permissions can be assigned to both Users and Usertypes.

15. Click the Finish button to acquire the new device.
Note: The process of acquiring a new device may take several minutes. To force acquisition of the device, select the device and go to
SNMP > SNMP Re-acquire in the NetMonitor menu bar.
* Custom MIBs may be required for some devices. Custom MIBs allow polling Non-SonicWALL or Non-Standard based SNMP enabled devices and to poll information specific to a certain device based on Manufacturer ID.These MIBs have to be placed in the etc\mibs folder by the GMS Administrator on the Web Server and Monitoring Agent machine(s) in order to use it for probing.
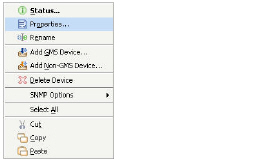
You can edit some of the properties of a specific device by right-clicking the device you want to edit, then click Properties. Multiple devices can be selected by holding Ctrl + selecting the devices.
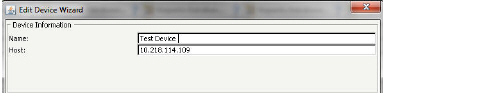
When editing a single Non-GMS managed device, the Edit Device wizard displays, where you can edit the device Name and Host IP address in their respective fields.
Continue with the device wizard to edit Monitor Information and Realtime Monitor Template Information. Note these are the same setting you originally configured when adding the device.
When editing a GMS Managed device or multiple devices, the Properties screen displays:
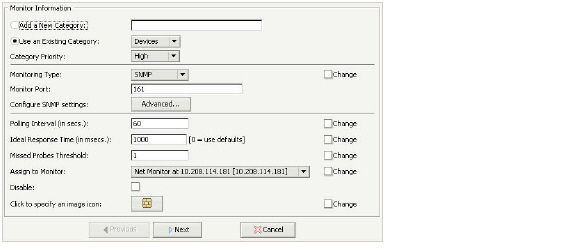
The Change checkbox appears next to each of the fields that have a difference in values for that field among the devices selected. If there are no differences, the field does not appear. Once the Change checkbox is selected, the value for the corresponding field is overwritten on all selected fields.
Note that selecting the Disable checkbox will apply changes to all selected devices.
Click Finish to complete editing the device settings.
Note: You can only rename non-GMS devices. GMS devices cannot be renamed as the name is synched with the assigned name from the Tree Control automatically.
To delete a device, right click on the device you wish to delete and click Delete Device. A w
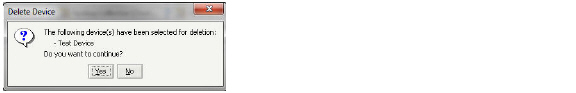
arning will display, confirming the device(s) you’ve selected to delete. Click Yes to continue.
Note Multiple devices can be selected by holding Ctrl + selecting the templates. Make sure to select all devices before right-clicking to delete.
Privileges to a device can now be assigned on a per user or per user group basis. When adding a Net Monitor device, an Assign Permission dialog box displays in the Add Device Wizard, listing all users in the system. Upon adding the device(s), you will also be able to select the users and user groups to grant permissions to.
To add or update permissions to an existing device, navigate to Console > Management > Edit Users
When a device is configured for monitoring, the data retrieved form these devices are displayed in the form of a realtime monitor. The following lists several procedures to create and manage realtime monitors:
• “Creating a Realtime Monitor” section on page 734
• “Managing Templates for Realtime Monitors” section on page 736
The Manage Realtime Monitor Dialog enables you to create custom realtime monitors.
1. From the Net Monitor page, select the device(s) you wish to create a realtime monitor for.
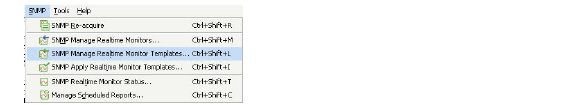
2. In the menu bar, go to SNMP > SNMP Manage Realtime Monitors.

The SNMP Manage Realtime Monitors page displays.
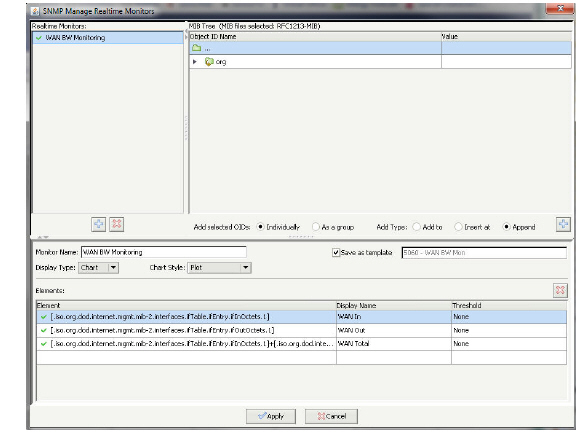
3. Click on the  button on the left side of the screen (under Realtime Monitors) to add a new realtime monitor
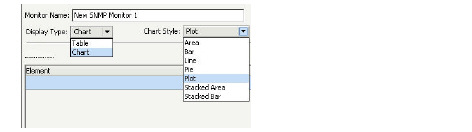
4. Add a friendly name for the new monitor in the Monitor Name field.
5. If you wish to save the new monitor as a template for future use, select the Save as template checkbox.Then, add a friendly name for the template.
6. Choose your display type and chart style as follows:

|
7. Navigate to the MIB Tree list and select the OIDs you wish to add.
8. In the Middle of the screen, select your preferences as follows:

|
Note It is important that the elements present in a Realtime Monitor Template contain OIDs that are present : in the devices that the template is applied to. Applying a template which contains un-relevant OIDs can produce unexpected results.
9. Click the  button on the right side of the screen (under MIB Tree) to add the selected MIB(s) to the Elements list.
Tip Alternate ways of adding a MIB to the Elements list include double-clicking the MIB and dragging and dropping the MIB from the MIB Tree into the Elements list.
10. Enter a friendly name for the element you just added by double-clicking the display name field corresponding to the new element.
11. Specify a threshold value for the alert monitor in the Threshold field corresponding to the new element.
12. Click the Apply button to save changes and create the realtime monitor.
Managing Templates for Realtime Monitors
A set of Realtime Monitor templates are available for every appliance type the GMS manages, including UMA and Windows. This section allows the user to manage the two types of templates in the system: User-defined and System-Defined. User-defined templates are created from other Realtime Monitors by selecting the Save as Template checkbox. User-defined templates can be edited or deleted. For user friendliness, system-defined templates are created as Factory Default templates. Unfortunately, these templates are read-only and cannot be edited or deleted.
Users can manage factory templates by following the procedures below:
1. Navigate to the SNMP > SNMP Manage Realtime Monitor Templates screen.
2. The list of available Realtime Monitor Templates appears on the left side of the screen. Select the template you want applied to the device.

3. Edit the existing name in the Monitor Name field.
4. Choose your display type and chart style as follows:
|
5. Navigate to the MIB Tree list and select the OIDs you wish to add.
6. In the Middle of the screen, select your preferences as follows:

|
Note It is important that the elements present in a Realtime Monitor Template contain OIDs that are present : in the devices that the template is applied to. Applying a template which contains un-relevant OIDs can produce unexpected results.
Creating a Realtime Monitor From a Template
Complete the following steps to set up a realtime monitor using one or more templates:
1. Select the device(s) you wish to create a realtime monitor for.
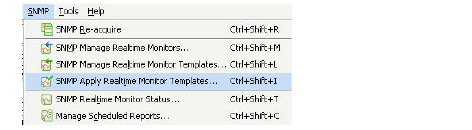
2. In the menu bar, go to SNMP > SNMP Apply Realtime Monitor Templates.
3. Select the templates (ctrl-click for multiple selections) you wish to use for monitoring the selected device(s).
Note Multiple templates can be selected by holding Ctrl + selecting the templates. The Filter search bar allows you to narrow the list of templates. Perform an exact match search by using double quotation marks, for example “template name”, or search with no quotation marks to search through multiple keywords.
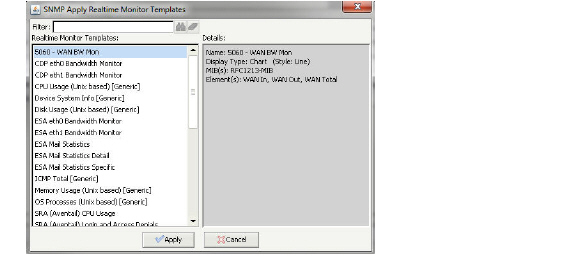
4. Click the Apply button to create the Realtime Monitor.
Viewing Realtime SNMP Monitoring Information
GMS NetMonitor allows you to view realtime monitoring data for one or multiple devices simultaneously. Data represented in these charts will show the last hour of activity for the specified node. To view the realtime monitoring information for one or more devices, follow the procedures listed below:
1. Select the device(s) you wish to monitor from the GMS NetMonitor main status screen (Ctrl-click for multiple devices).
2. In the menu bar, select SNMP > SNMP Realtime Monitor Status.
3. In the Realtime Monitors window, select one or more nodes to monitor. The appropriate graphs and or tables will be loaded into the monitoring window on the right side of the screen.
Note Data in the monitoring windows is refreshed automatically based on the auto-refresh interval specified in NetMonitor Preferences. While you may do a manual refresh of the graphs and charts, it is not necessary.
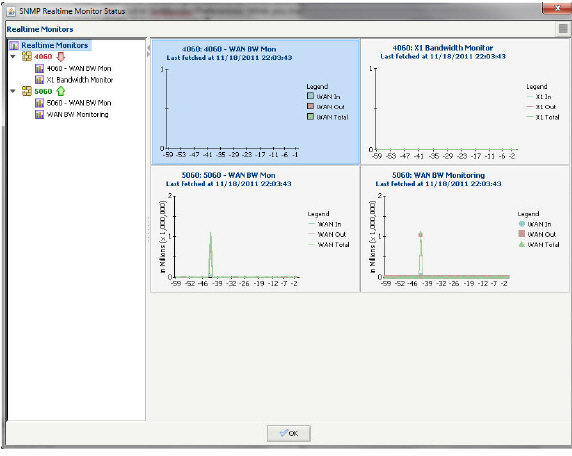
4. To display historical charts (daily, weekly, monthly) for a node, double-click on the desired realtime graph in the monitoring window on the right side of the screen.
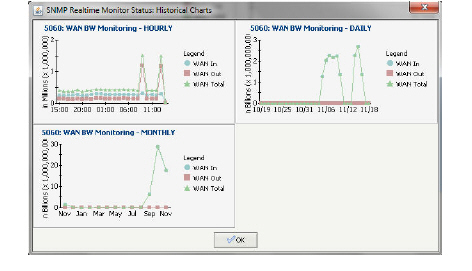
Note Only one history chart window may be opened at a time. It is possible, however, to display historical charts for multiple nodes by selecting the charts you wish to view with ctrl-click, and then clicking the ![]() button at the top right side of the screen.
button at the top right side of the screen.
Managing Severity and Thresholds
Configuring Severity and Thresholds allows you to be notified when the value of a monitored OID exceeds a set level. These levels are set in the Manage Severity dialog and are then used to define your alerts by assigning a level of severity to each threshold, set in the Manage Threshold dialog.
The Severities and Thresholds are now linked to the Granular Events Management (GEM) framework. This allows you to configure severities and thresholds from the Net Monitor tab, or navigate to the Console > Events screen to configure and verify changes there.
This section contains the following subsections:
• Viewing Threshold Alerts in the Dashboard
• Managing SNMP Scheduled Reports
• Setting E-mail Threshold Alerts
To configure your Severity settings:
1. In the menu bar, select Tools > Manage Severity.
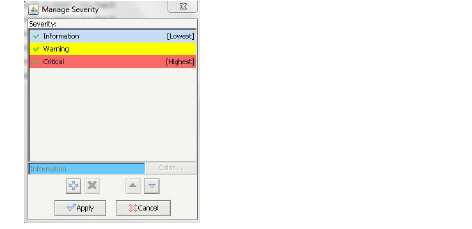
2. Add a new severity by clicking the  button and entering a name for the severity.
3. Move the new severity to a different priority level by having the severity selected in the list and using the  and
and  buttons.
4. Change the color of the severity by having the severity selected in the list and clicking the  button.
5. To delete a severity, have the severity selected in the list, and click the  button.
Note A severity can not be deleted if it is being used by one or more threshold elements. Ensure all corresponding threshold elements are not associated with that severity before attempting to delete. Severities are global settings and is available to use across the system.
Every element in a threshold is assigned an operator, value, and severity. Thresholds are ways of defining conditions that monitor specified object identifier (OID) values. When the defined condition is met, the threshold is triggered, and severity helps to identify the priority of the triggered threshold. To configure your thresholds:
1. In the menu bar, select Tools > Manage Thresholds.
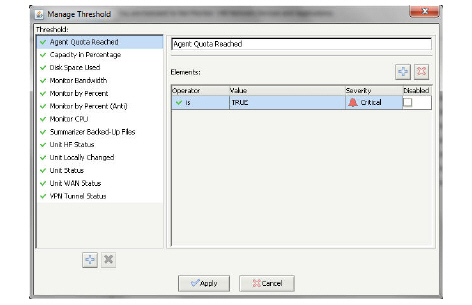
2. Click the  button under Threshold and enter a friendly name to add a new threshold.
3. Click the  button under Elements to add a new element to the threshold.
4. Configure the Operator, Value, and Severity fields in the new element as follows:
|
You may also disable a specific threshold by selecting the Disabled checkbox. The following threshold triggers a Low-level Warning at a value of less than 100000 bytes.

5. Click the Apply button to save your changes.
Note Thresholds are global settings and is available to use across the system.
To delete a Threshold, select the threshold and click the  button.
Viewing Threshold Alerts in the Dashboard
The Dashboard View is a screen where an alert about an SNMP Realtime Monitor satisfying user-defined threshold conditions are displayed. When a threshold alert is triggered, information about the device, realtime monitor, and the element that triggered the alert is shown on this screen.

Managing SNMP Scheduled Reports
You can schedule reports from realtime monitors to be sent by email or archived to a location on disk. To create a scheduled report, navigate to the Dashboard> Universal Scheduled Reports screen:

For more information regarding managing SNMP Schedule Reports, refer to the “Using the Universal Scheduled Reports Application” section on page 73.
Setting E-mail Threshold Alerts
GMS NetMonitor, now at a granular per device level, allows users to configure multiple destinations based on schedules. Alerts for that unit are then sent to the specified destinations based on the specified schedules. Alert settings now supports adding a maximum of five destinations for specified devices.
To set email threshold alerts:
1. Select the device(s) you wish to configure alerts for from the GMS NetMonitor main status screen by clicking (ctrl-click for multiple devices).
2. In the menu bar, select Tools > Alert Settings.
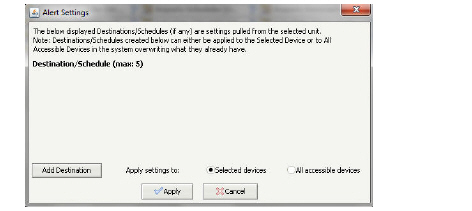
3. Click the Add Destination button to add a new destination. You are able to add a maximum of five destinations/schedules.
4. Select the Destination from the pull-down menu.
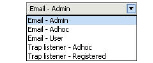
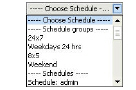
5. Next, choose the Schedule you want applied to this destination.
6. Select whether you want these settings applied to just the Selected Device or All Accessible Devices. Note that selecting the latter option will overwrite any existing settings for the affected devices.

7. Click Apply to complete adding alerts. A warning may display, notifying you that the Alert Settings will reset to the newly specified settings. Click Yes to continue.
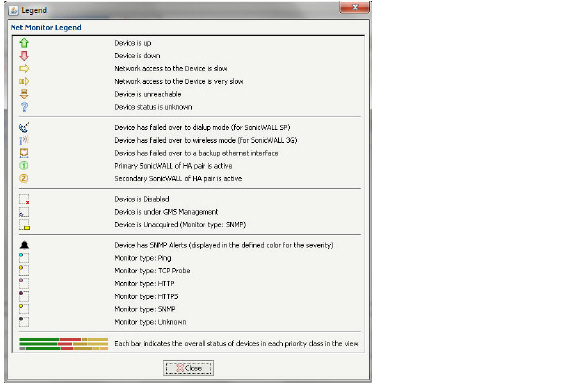
To see all icon definitions used in the NetMonitor section, navigate to the Help > Legend screen:
Monitoring Devices Behind a SonicWALL Appliance
To monitor devices behind a SonicWALL appliance, do one of the following:
• Create a VPN tunnel to the remote firewall that makes all LAN subnets accessible to the Net Monitor.
• Create NAT Policies that allow specific types of traffic through.
For example, if TCP Probe is chosen as the monitor type, TCP connections must be allowed to the specified port. If Ping is chosen as the monitor type, ICMP must be allowed.
Adding Custom Icons to the Net Monitor
The Net Monitor supports custom icons that it will display in the Net Monitor window. The icons must be 16 x 16 pixels and created in the .GIF format. To add new icons to the Net Monitor, copy them to the following directory:
<gms_directory>\Tomcat\webapps\sgms\images\monitor