Reporting_Firewall
The Reports available under the Firewall tab provide specific information on data gathered by the Dell SonicWALL GMS interface.
For a general introduction to reporting, see the Dell SonicWALL GMS Reporting Overview.
The Firewall reports display either summary or unit views of connections, bandwidth, uptime, intrusions and attacks, and SRA usage, displayed in a Data Container. Information can be viewed in either chart (timeline or pie chart) form, or tabular (grid) format. The list of available reports allows you to navigate to a high-level or specific view.
All of the reports in Dell SonicWALL GMS report on data gathered on a specific date or range of dates. Data can be filtered by time constraints and data filters.
Benefits of Firewall Reporting
Firewall Reports allow you to access both real-time and historical reports and view all activity on SonicWALL Internet security appliances. By monitoring network access, logins, and sites accessed, you can enhance system security, monitor internet usage, and anticipate future bandwidth needs.
You can gain more information from the display, simply by hovering the mouse pointer over certain sections. Additionally, by clicking on selected sections of a pie chart or bar-graph timeline view, you can view more information or view different aspects of the information presented.
The Firewall tab gives you access to the Firewall’s reports section of the Dell SonicWALL GMS management interface. Reporting supports both graph and non-graph reports, and allows you to filter data according to what you wish to view. It supports multiple product-licensing models.
Firewall Reports provide the following features:
• Clickable reports with drill-down support on data rows
• Report data filtering through the Search Bar
• Log Analyzer
You can view Reports either as Summary reports for all or selected units on the Dell SonicWALL GMS network, or view detailed reports for individual units.
Viewing Available Firewall Report Types
To view the available types of reports for the Firewall appliances, perform the following steps:
1. Log into your GMS management console.
2. Click the Firewall tab.
3. Select an appliance, global view, or group of appliances from the TreeControl.
4. Click the Reports tab on the top of the screen.
5. Expand the desired selection on the Reports list and click on it.
Note: All Reports show a one-day period unless another interval is specified in the Time Bar.
The following types of reports are available:
Global Level Reports:
• Data Usage
– Summary: connections, listed by appliance, for one day (default)
• Applications
– Summary: connections, listed by application, for one day (default)
• Web Activity
– Summary: hits, listed by appliance, for one day (default)
• Web Filter
– Summary: access attempts, listed by appliance, for one day (default)
• VPN Usage
– Summary: VPN connections, listed by appliance, for one day (default)
• Threats
– Summary: connection attempts, listed by appliance, for one day (default)
Note: Summary Reports are not drillable and no Detail view is available.
Unit Level Reports
Detail views are available for all Report items unless otherwise noted.
• Data Usage
– Timeline: connections for one day (default)
– Initiators: Top Initiators, listed by IP address, Initiator Host, User, and Responder, displayed as a pie chart
– Responders: Top Responders, listed by IP address, Responder Host, and Initiator, displayed as a pie chart
– Services: connections, listed by service protocol, displayed as a pie chart
– Details: provides a shortcut to the Detail view normally reached by drilling down. Detail sections include: Initiators, Services, Responders, Initiator Countries, and Responder Countries. Additional filtering/drilldown takes you to the Log Analyzer
• Applications
– Data Usage connections, listed by application and threat level
– Detected: events, listed by application and threat level
– Blocked: blocked events, listed by application and threat level
– Categories: types of applications attempting access
– Initiators: events displayed by Initiator IP and Initiator host
– Timeline: events over one day
• User Activity
– Details: a detailed report of activity for the specified user
• Web Activity
– Category: hits and browse time listed by information category
– Sites: sites visited by IP, name, and category, with hits and browse time
– Initiators: Initiator host and IP with category and user
– Timeline: site hits with time of access and browse time
– Details: provides a shortcut to an access timeline and Detail view normally reached by drilling down. Detail sections include: Categories, Sites, and Initiators.
• Web Filter
– Category: hits and browse time listed by information category
– Sites: sites visited by IP, name, and category, with hits and browse time
– Initiators: Initiator host and IP with category and user
– Timeline: site hits with time of access and browse time
– Details: provides a shortcut to an access timeline and Detail view normally reached by drilling down. Detail sections include: Categories, Sites, and Initiators.
• VPN Usage
– Policies: lists connections by VPN Policy
– Initiators: Initiator host and IP with category and user
– Services: Top VPN Services by Service Protocol
– Timeline: VPN connections over a 1 day period
• Intrusions
– Detected: number of intrusion events by category
– Targets: number of intrusion events by target host and IP
– Timeline: intrusions listed by time of day
• Gateway Viruses
– Blocked: blocked virus attacks and number of attempts at access
– Targets: targeted hosts and IP addresses
– Initiators: initiating users, hosts, and IP addresses of the virus attack
– Timeline: times when the virus attempted to gain access, displayed over time
• Spyware
– Detected: spyware detected by the firewall
– Blocked: spyware blocked by the firewall
– Targets: targeted hosts and IP addresses
– Initiators: initiating users, hosts, and IP addresses of spyware download
– Timeline: times when the spyware accessed the system, displayed over time
• Attacks
– Attempts: type of attack and times access was attempted
– Targets: host and IP address, and number of times access was attempted
– Initiators: top attack initiators by IP and host
– Timeline: time and number of attempts at access, displayed over time
• Authentication: authenticated users, their IP addresses, and type of login/logout
– User Login
– Admin Login
– Failed Login
• Up/Down
– Timeline: provides a timeline of unit availability. No Detail sections are available.
• Custom Reports: allows access to saved custom reports
• Analyzers
– Log Analyzer: provides a detailed event-by event listing of all activity. The Log Analyzer is drillable, but no Detail sections are available.
• Flow Activity
– Real-Time Viewer: real-time data displayed graphically.
– Top Flows Dashboard: displays top flows per report type.
– Flow Analytics: monitors applications, users, URLs, initiators, responders, threats, VoIP, VPNs, devices, and contents.
– Flow Reports: real-time reports displayed graphically.
Understanding the Data Container
The Report contains a filter bar at the top, plus the actual Data Container. The default Data Container contains an interactive chart view, which contains either a grid view, containing a text version of the information. One or more sections may be present in the grid view. Toggle buttons allow you to display the Chart view, Grid view, or Chart and Grid view.
Grid sections are arranged in columns. Columns may be rearranged to view them from the top down or bottom up, by clicking the up and down arrows in the column headings. You can narrow results by applying a filter to a column: right-click on a column heading and click Add Filter.
Hypertext-linked columns are drillable, meaning you can click on the hypertext entry to bring up a Detail view with more information on the desired entry. Detail views might have multiple sections.
The Detail views are usually reflected in the sub-headings under the Reports list, which provide a shortcut directly to the Detail Report. To go to the full Detail view, click the Details entry in the Reports list. From the Detail view, you can access the system logs, for event-by-event information, or further filter the results. For more information on using the Log Analyzer to view and filter syslog reports, see the Using the Log Analyzer.
Details views can contain multiple sections. To determine if you have reached the end of the list of sections, check for the time zone message, which indicates the end of the Detail View.
Reports with hyperlinked columns can be filtered on the column or by drilling down on the hyperlinked entry.
You can also get to a filtered Detail view by clicking the section representing the desired information in the pie chart.
To save a filtered view for later viewing, click on the Save icon on the Filter Bar. The saved view will now appear under Custom Reports.
To learn more about Custom reports, see the Custom Reports
The Firewall Summary reports display an overview of bandwidth, uptime, intrusions and attacks, and SRA usage for managed SonicWALL Firewall appliances. The security summary report provides data about worldwide security threats that can affect your network. The summaries also display data about threats blocked by the SonicWALL security appliance.
You can view Firewall Reports as either as global or group summary reports, or by individual unit:
• Viewing Global Summary Reports
• Viewing Status Uptime/DownTime Summary Reports
Viewing Global Summary Reports
Summary reports for data usage, applications, web usage and filtering, VPN usage, and threats for managed SonicWALL appliances are available at the global level, through the TreeControl menu. Summary reports are available for:
• Data Usage
• App Control
• Web Usage
• Web Filtering
• VPN Usage
• Threats
Group-level Summary reports provide an overview of information for all Firewalls under the group node for the specified period. The report covers the connections and transfers by appliance for Data Usage, App Control, and VPN Usage, For Web Usage and Web Filters, hits are also included. Web filters and Threats list attempts at connection. Unless specified differently in the Date Selector, the Summary report covers a single day. Global Summary reports are not drillable.
To view the Summary report, perform the following steps:
1. Click the Reports tab.
2. Select the global icon or a group of appliances.
3. Click Data Usage > Summary.
The timelines at the top of the page display the totals, and the grid section sorts the information by appliance or applications.
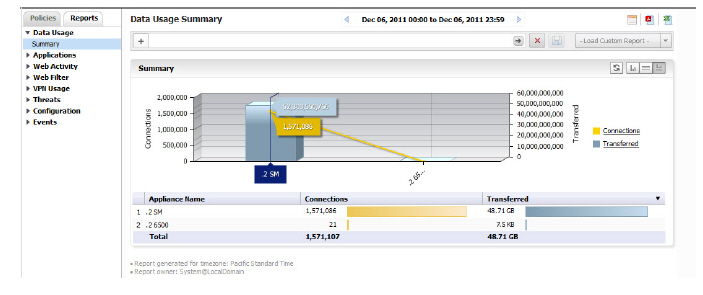
Similar summary reports are available for all the Global or Group reports specified above.
Viewing Unit Level Status Reports
Unit level reports display status for an individual SonicWALL appliance. From this information, you can locate trouble spots within your network, such as a SonicWALL appliance that is having network connectivity issues caused by the ISP. You can also monitor web usage, including attempts to reach filtered sites, as well as incoming attacks on your network.
Note Global reports are displayed in the GMS’s timezone. Reports for individual SonicWALL security appliances are displayed in the individual appliance’s time zone.
Viewing Data Usage Reports
The default Data Usage report displays a timeline for hours that the selected SonicWALL appliance was online and functional during the time period with connections, transferred connections, and cost displayed.
1. Click the Reports tab.
2. Select the global icon, a group, or a SonicWALL appliance.
Click Data Usage > Timeline. (This is the default view when the Firewall Report interface comes up.)
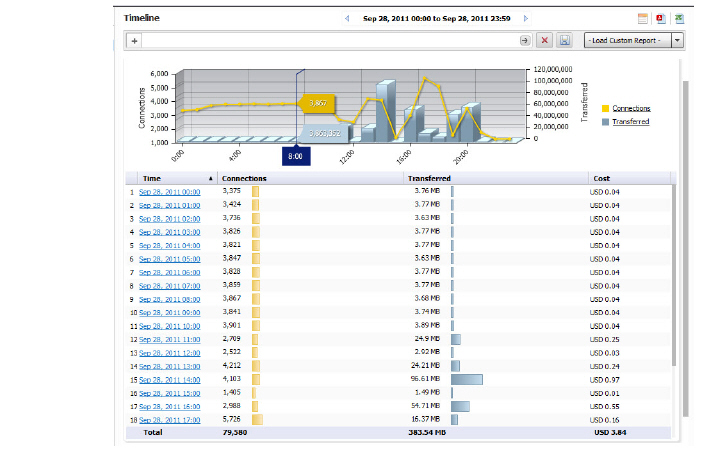
This report is drillable. Click on an Initiator IP entry to break the Timeline report down into its Detail View report groups for the selected IP address. These groups also contain drillable hyperlinks that will take you to more specific Detail View information. The columns can also be filtered on. For more information on drilling down in a report, refer to Drilling Down
The following Section entries are available:
• Initiators: Initiators are grouped by IP, Host, User Name, Connections, and Transferred Connections
• Responders: Responders are grouped by IP, Host, User Name, Connections, and Transferred Connections
• Services: connections from the various services
• Details: Provides a shortcut from the Details View
Viewing User Activity Logs
Web User Activity logs allow you to filter results to view only the activity of a specific user.
The User Activity Analyzer provides a detailed report listing activity filtered by user. If a user report has been saved previously, bringing up the User Activity Analyzer will display a list of saved reports under the Filter Bar.
If you wish to create a new report, use the Filter Bar to create a new report.
1. Click the Reports tab.
2. Select a SonicWALL appliance.
3. Click on User Activity > Details to bring up the User Activity Analyzer. The User Activity Analyzer generates a Detail report based on the user name.
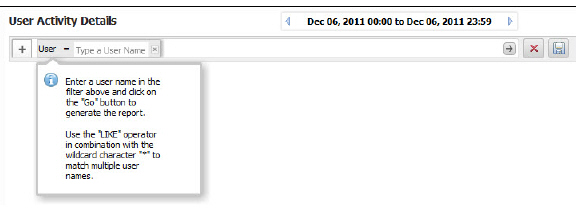
If no user activity reports were saved, only the Filter Bar will display, with the User filter pre-selected. You can enter a specific user name, or use the LIKE operator wildcards (*) to match multiple names.
4. Enter the name of the user into the field and click the Go (arrow) button to generate the report
The customized User Activity Details report will display a timeline of events, Initiators, Responders, Services, Applications, Sites visited, Blocked site access attempted, VPN access policy in use, user authentication, Intrusions, Initiator Countries, and Responder Countries associated with that particular user.
Data for a particular user may not be available for all of these categories.
Viewing Applications Reports
Application Reports provide details on the applications detected and blocked by the firewall, and their associated threat levels.
1. Click the Reports tab.
2. Select a SonicWALL appliance.
3. Click Application > Data Usage.
The Applications Report displays a pie chart with the application and threat level it poses.
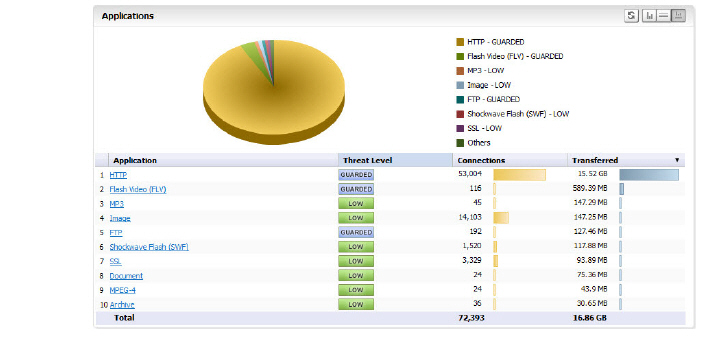
You can drill down for additional Details views on connections over time (Timeline view), Data Usage, Detected applications, Blocked applications, Categories of applications, top initiators.
Viewing Web Activity Reports
Web Activity Reports provide detailed reports on browsing history.
1. Click the Reports tab.
2. Select a SonicWALL appliance.
3. Click Web Activity > Categories.
The Web Activity Report displays a pie chart with the Top Categories of type of access, total browse time, and hits.
You can drill down for additional Details views on connections over time (Timeline view), Sites visited, Categories of sites, and Top Initiators. A Details entry links directly to the details view of all entries.
Viewing Web Filter Reports
Web Filter Reports provide detailed reports on attempts to access blocked sites and content.
1. Click the Reports tab.
2. Select the global icon, a group, or a SonicWALL appliance.
3. Click Web Filter > Categories.
The Web Filter Report displays a pie chart with the Top Categories of blocked access and total attempts to access.
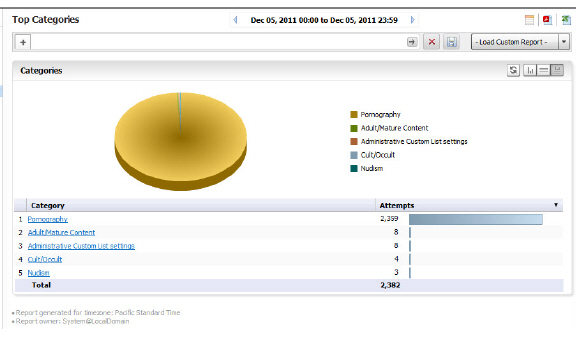
You can drill down for additional Details views on connections over time (Timeline view), Sites visited, Categories of sites, and Top initiators. A Details entry links directly to the details view of all entries.
Viewing VPN Usage Reports
VPN usage reports provide details on the services and policies used by users of virtual private networks.
1. Click the Reports tab.
2. Select a SonicWALL appliance.
3. Click VPN Usage > Policies.
The VPN Usage Report displays total connections for each VPN Policy item as a pie chart and tabular grid view.
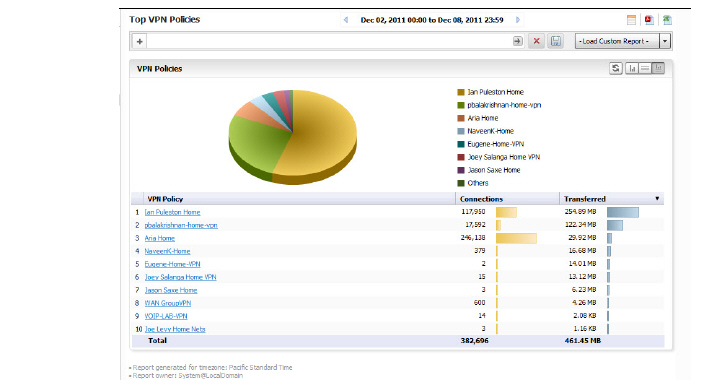
You can drill down for additional Details views on Service protocols and Top initiators.
Viewing Intrusions Reports
Intrusion Reports provide details on types of intrusions and blocked access attempts.
1. Click the Reports tab.
2. Select a SonicWALL appliance.
3. Click Intrusions > Detected.
The Attacks report provides a pie chart and a list of the initiating IP addresses, hosts, and users, with number of attempts for each.
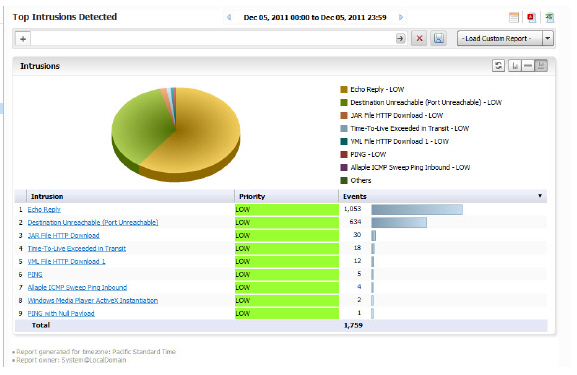
Drill down for additional Detail views of Intrusion Categories, Targets, Initiators, Ports affected, Target Countries, and Initiator Countries.
Viewing Gateway Viruses Reports
The Gateway Viruses reports provide details on the Top Viruses that were blocked when attempting to access the firewall.
1. Click the Reports tab.
2. Select a SonicWALL appliance.
3. Click Gateway Viruses > Blocked.
The Top Viruses report appears.
The report provides details on the viruses blocked, the targets, initiators, and a timeline of when they attempted access.
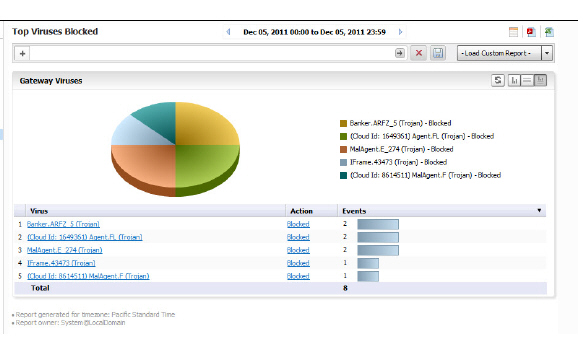
Drilling down provides a list of virus identity, Targets, Initiators, Target Countries, and Initiator Countries.
Viewing Spyware Reports
The Spyware report gives details of the spyware that was detected and/or blocked, the targets, initiators, and a timeline of when they attempted access.
1. Click the Reports tab.
2. Select a SonicWALL appliance.
3. Click Spyware > Detected.
The report provides details on the types of spyware detected and blocked, targets.
Drilling down provides a list of virus identity, Targets, Initiators, Target Countries, and Initiator Countries.Drilling down lists countries of origin, and target countries.
Viewing Attacks Report
The Attacks report lists attempts to gain access, target systems, initiators, and a timeline of when the attack occurred.
1. Click the Reports tab.
2. Select a SonicWALL appliance.
3. Click Attacks > Attempts.
The Attacks report provides a pie chart and a list of the initiating IP addresses and hosts.
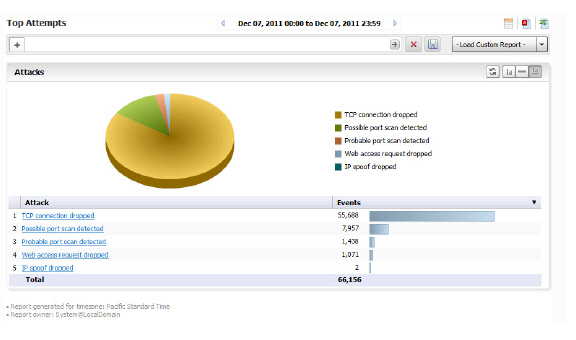
Drill down for additional Detail views of Intrusion Categories, Targets, Initiators, Ports affected, Target Countries, and Initiator Countries.
Viewing Authentication Reports
Authentication reports provide information on users attempting to access the Firewall.
1. Click the Reports tab.
2. Select a SonicWALL appliance.
3. Click Authentication > User Login.
The Authentication report displays a list of authenticated users, their IP addresses, service, time they were logged in, and type of login/logout. Additional Reports are available for Administrator logins and failed login attempts.
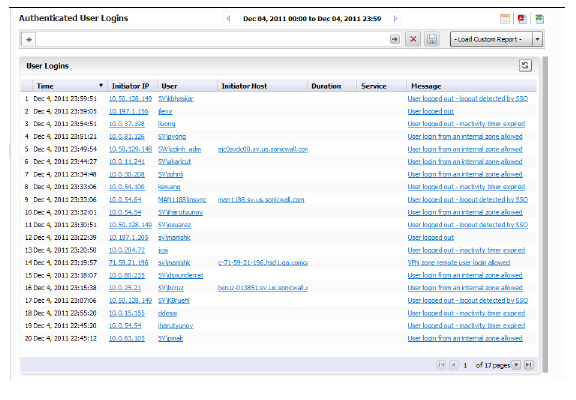
Clicking on hyperlinks provides additional filtering for the reports.
You can filter on the Service to view SRA and other appliances by drilling down to the syslog.
1. Go to the filter bar and click on the + and select Service from the pull-down menu. Click on the = operator, and click on the field next to it to bring up the pull-down menu. Select SSLVPN from the pull-down

list
2. Click Go to view a report for that Service.
Note For the Duration and Service categories to be present, the Firewall appliance firmware must be at least version 5.6.0.
Viewing Flow Activity Reports
The Flow Activity Reports offers administrators an effective and efficient interface to visually monitor their network in real time, providing effective flow charts of real-time data, customizable rules, and flexible interface settings. With the Flow Activity Reports, administrators can efficiently view and sort real-time network and bandwidth data in order to:
• Identify applications and websites with high bandwidth demands
• View application usage on a per-user basis
• Anticipate attacks and threats encountered by the network
The GMS management interface includes the following for Flow Activity: