Reports_FlowActivity_FlowReports_Snwls
Flow Reports
The Flow Reports page provides administrators with configurable scheduled reports by applications, viruses, intrusions, spyware, and IP. Flow Reports statistics enable network administrators to view a top-level aggregate report of what is going on in your network.
Flow Reports Tabs
The Flow Reports Tabs contains details about incoming and outgoing network traffic. Each tab provides a faceted view of the network flow.
The Applications tab displays a list of Applications currently accessing the network.:
• The Users tab displays a list of Users currently connected to the network.
• The IP tab displays a list of the IP addresses currently accessing the network.
• The Viruses tab displays a list of detected viruses on the network.
• The Intrusions tab displays a list of the attempted intrusions over the selected time period.
• The Spyware tab displays a list of detected spyware on the network.
• The Location tab displays a list of locations that users are accessing the network from.
• The URL Rating tab displays a list of rated URLs on the network.
Flow Reports Toolbar
The Flow Reports Toolbar allows for customization of the Flow Reports interface. The ability to create rules and add items to filters allows for more application and user control. Different views, pause and play abilities, customizable data intervals and refresh rates are also available to aid in visualizing incoming, real-time data.
|
Option
|
Widget
|
Description
|
|
Export
|

|
Exports the data flow in comma separated variable (.csv) format.
|
|
Print PDF Report
|

|
Generate an Application Visualization Report.
|
|
Refresh Button
|

|
Refreshes the real-time data.
|
|
Using the Log Analyzer
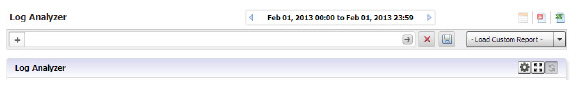
The Log Analyzer allows advanced users to examine raw data for status and troubleshooting. The Analyzer logs contain detailed information from the system logs on each transaction that occurred on the specified SonicWALL appliance. These logs can be filtered or drilled down to further narrow the focus of the information, allowing analysis of data about alerts, interfaces, bandwidth consumption, etc. The Log Analyzer is only available at the individual unit level.
Log information can be saved for later analysis and reloaded from Custom Reports.
To load a report for viewing, either:
• Click Load Custom Report and select from the pull-down list of saved Custom Reports.
• Click on Analyzers > Log Analyzer to view the current log.
Note The Log Analyzer entries display raw log information for every connection. Depending on the amount of traffic, this can quickly consume a large amount of space in the database. It is highly recommended to be careful when choosing the number of days of information to be stored.
Viewing the Log Analyzer
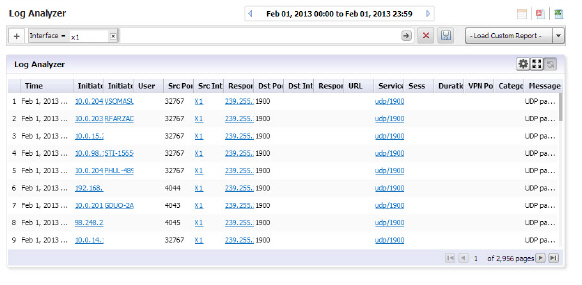
The log displays information specific to either a particular report or overall system information, depending on the path used to reach the log, either from the individual report level or from the Log Analyzer entry on the Reports tab. Entries in the Analyzer log will vary, according to the relevant report type. You can customize the log entries by using the following options:
Show/Hide Log Columns
Use the Show/Hide Columns function to hide columns that you do not want to display in the Analyzer Log. Just click the Configure the Log Analyzer icon, then select the columns that you want to display and deselect the ones that you do not want to display. By configuring the displayed columns, the Log Analyzer gives a more clean, concise, and meaningful way to view the logs, instead of displaying unnecessary columns that take up valuable real estate.
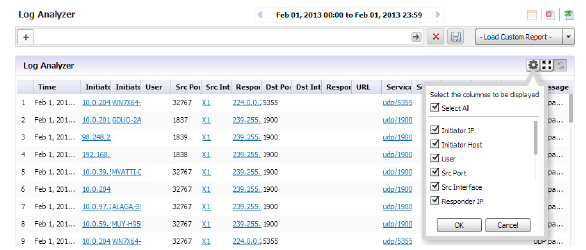
Note “Serial number” column and “Time” column are not part of the list to be configured because they are necessary for any displays.
Row-Based Expansion
Instead of showing all the column info at once, the row-based expansion simplifies the screen and gives on-demand info through a single click.
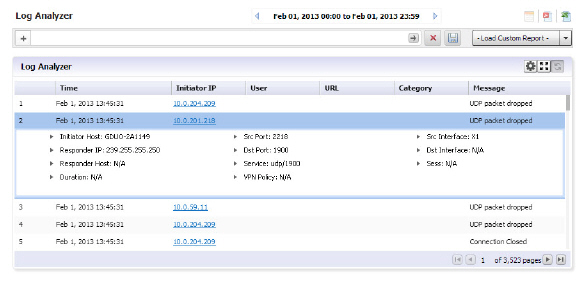
Click on each row to pull down the hidden column information.
Note This feature is only available after you sort the columns using the show/hide function.
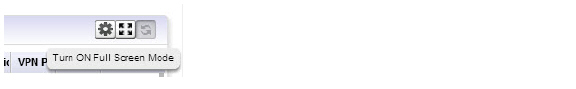
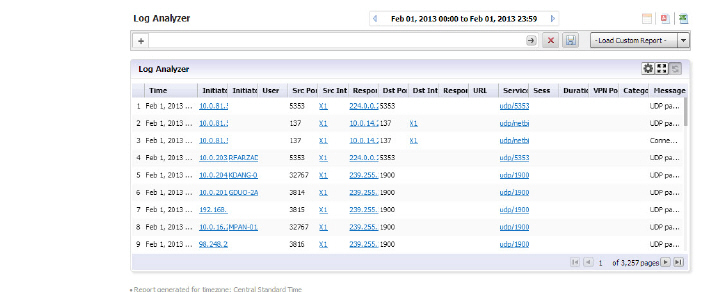
Full Screen Mode
Switch to full screen mode by clicking the Full Screen Mode toggle icon. This will populate the entire browser screen with the Log Analyzer page, hiding the tree control and reports panels.
Session-Based Configurations
All column configurations for the Log Analyzer are recorded in each session. This is so that within the session, users can have the desired/configured tabular view of the Log Analyzer at all times.
Priority
The log event messages are color-keyed according to priority. Red is the highest priority, followed by yellow for Alerts. Messages without color keys are informational, only. The color categories are:
• Alert: Yellow
• Critical: Red
• Debug: White
• Emergency: Red
• Error: White
• Info: White
• Notice: White
• Warning: White
Color keys allow you to immediately focus on the priority level of the message, and filter data accordingly.
Filtering the Analyzer Log
The Log Analyzer allows you to add filters to view user-or incident-specific data. The Log analyzer can be reached either by drilling down in individual reports, or from the Analyzers item under the Reports tab.
To view the Analyzer Log, perform the following steps:
1. Click the Reports tab.
2. Select a SonicWALL appliance from the TreeControl pane.
3. Click to expand the Analyzer tree and click on Log Analyzer. The saved Log Analyzer report page displays.
Note: Because system logs have a large number of entries, it is advisable to constrain the number of entries displayed on the page.
Saved system logs are limited in the number of rows that will be saved. If saving to PDF, a maximum of 2500 rows will be saved. If saving to Excel, a maximum of 10,000 rows will be saved.
4. To add a filter, click on the + in the Filter Bar and specify the desired filter item and parameters.
Available filters include filters for Application, Category, DST Interface, DST Port, Duration, Initiator Country, Host, or IP address, Interface, Message, Priority, Responder country, IP, or Name, Service, Session, Src Interface, Src Port, URL, User, or VPN Policy. This full list is available from the Log Analyzer Entry.
If you are viewing the log in the Log Analyzer view for a specific application entry, only those filters specific to that entry will be available.
Log views are drillable, and will add filters as column entries are drilled. Click on an entry of interest to add a filter and further constrain the information displayed.
Log Analyzer Use Case
In the following use case, we will sort and filter the captured event information to evaluate threats targeted toward the X0 default interface.
On the Reports tab, click on Analyzers > Log Analyzers.
1. In the Log Analyzer, click on the + to add a filter, and select the Interface filter.
2. Type in X1 to specify the default interface filter.
3. Click on the Go button.
The Log Analyzer will be filtered on the X1 port interface.
This will allow you to begin debugging, or further investigate use of the database.
More information can also be found by using Universal Scheduled Reports.
Viewing Status Uptime/DownTime Summary Reports
The Status Up-Time Summary report contains information on the status of a SonicWALL appliance or group of appliances during each hour of the specified day.
To view the Status Up-Time Summary report, perform the following steps:
1. Click the Reports tab.
2. Select the global icon, a group, or a SonicWALL appliance.
3. Expand the Status tree and click Up-Time Summary. The Up-Time Summary page displays.
The bar graph displays the amount of time the SonicWALL appliance(s) were online and functional during each hour of the day.
The Report contains the following information:
• Hour—when the sample was taken.
• Up Time—number of minutes during the hour that the SonicWALL appliance was “Up.”
• Down Time—number of minutes during the hour that the SonicWALL appliance was “Down.”
• Up Time %
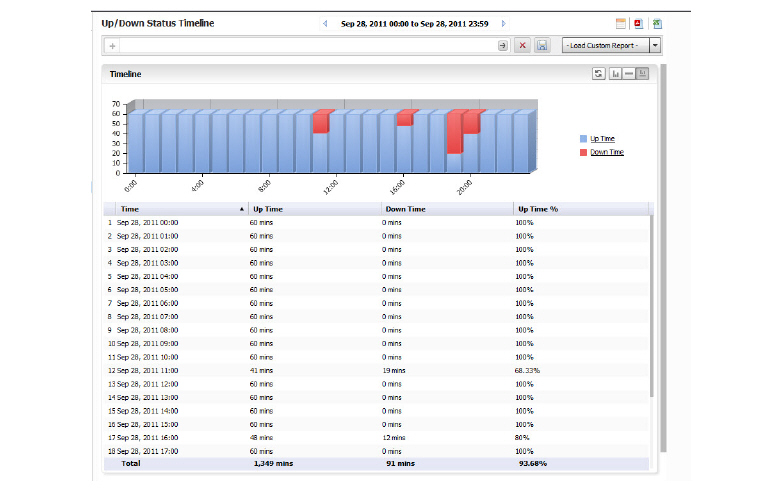
—percentage of time the SonicWALL appliance was “Up” over the hour.
4. By default, the GMS Reporting Module shows yesterday’s report. To change the date of the report and other settings, click the date field to access the pull-down calendar, or click the backward arrow to page further back in time, on a day-by-day basis.
Configuration Settings
Configuration settings allow you to set up certain parameters for how data is displayed in Reports. You can set up currency cost per Megabyte for the Summarizer, or add filters for the Log Analyzer reports.
Setting Up Currency Cost for Summarizer
The Data Usage page contains a Cost per connection entry. You can set what currency and the cost per Megabyte.
1. Click Configuration > Settings on the Reports tab.
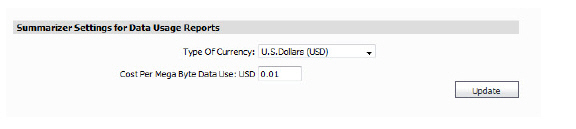
2. Select the currency of the desired country and the cost per MB.
3. Click Update. The cost will be immediately reflect on the Data Usage page.
Adding Syslog Exclusion Filters
Exclusion Filters restrict what information is used to generate Reports. This is achieved by filtering out syslogs (based on the criteria specified in the Syslog Filter screen) from being uploaded to the Reports database. These filtered syslogs are, however, stored in the file system and archived, thus ensuring that all syslogs are available for audit trailing purposes. Excluding data from being uploaded to the Reporting database in this way can be useful in maintaining confidentiality regarding use history, or eliminating data corresponding to certain users who are not of interest. For instance, you might use an Exclusion Filter to eliminate data from the company CEO. This screen is used to specify syslog filters for the unit selected in the TreeControl. A similar screen exists for system wide syslog filtering, in the Console Panel’s Reports > Syslog Filter screen
1. To add an Exclusion filter, click on Configuration > Filters.
The Syslog Exclusion Filter page comes up. This page allows you to view what filters are currently applied, add filters, or remove filters.
2. To configure and add an Exclusion Filter, click Add Filter. The Add Filter menu comes up.
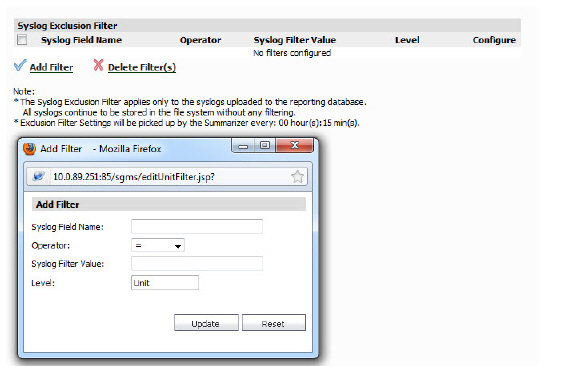
3. Specify the field you want to modify, and select an operator and value. Click Update.
The Reports will now be filtered according to the selected criteria. Exclusion Filter settings are picked up by the Summarizer at specified regular intervals.
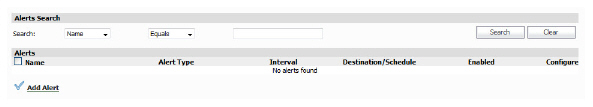
Alerts
The Events entry on the Reports tab allows you to configure and view alerts specific to Reporting for the unit selected”. The Events entry on the Reports tab allows you to configure and view alerts specific to Reporting for the unit selected, through the Alert Settings and Current Alerts items.
You can follow specific alerts. For more information, refer to the Using Granular Event Management.
1. Click on Events > Alert Settings.
The Alerts menu comes up. You can use this menu to search for Alerts by name or type, either by exact match or matching strings. Click Search to find an Alert of interest.
2. You can also add an alert. Click Add Alert on the Alerts menu. The resulting pop-up menu allows you to specify the type of data you want to track, how often to poll for data, and whether it is visible to only administrators or to non-administrators as well.
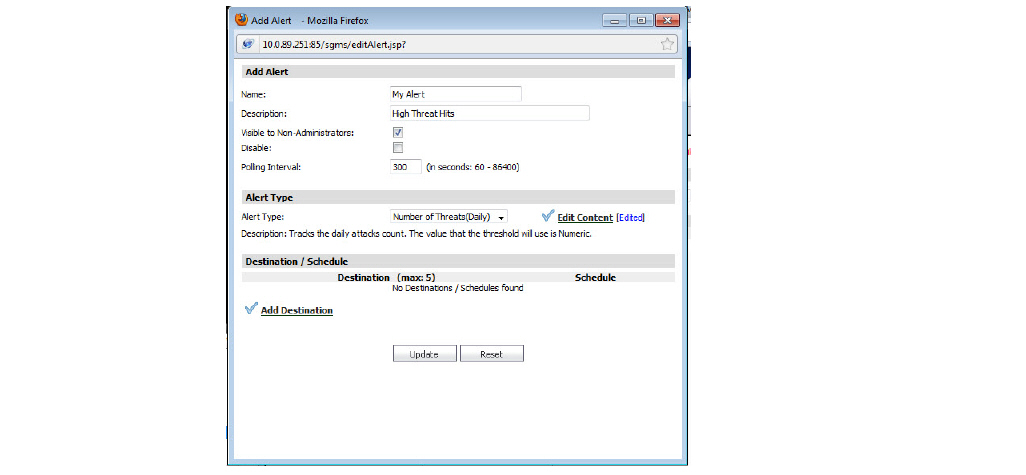
Alert Types are pre-defined, static parameters and are not customizable. Available categories are:
|
Alert Type
|
Description
|
|
Bandwidth usage (Billing Cycle)
|
Tracks the bandwidth total in bytes per billing cycle. The value that the threshold will use is Numeric.
|
|
Bandwidth Usage (Daily)
|
Tracks the daily bandwidth total in bytes. The value that the threshold will use is Numeric.
|
|
Events/Hits (Daily)
|
Tracks the daily events/hits total. The value that the threshold will use is Numeric.
|
|
Number of Threats (Daily)
|
Tracks the daily attacks count. The value that the threshold will use is Numeric.
|
|
3. Select the Alert Type and click on Edit Content to edit threshold values. A popup menu will come up. You can choose from the preset Threshold values or create a new threshold value by clicking the icon to the right of the Threshold banner. Only one new threshold can be created at a time. For more information on thresholds, see the Configuring Event Thresholds.
Note Threshold values may not be available for all Alert types. If this is the case, the Edit Content field will not be present.
4. Alerts can be emailed to you or a specified destination on a regular schedule. You can specify up to 5 destinations. Click Add Destination to enable and select from the pull-downs of destination and schedule entries.
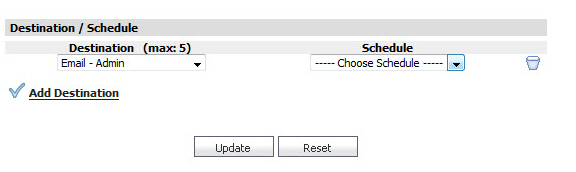
5. Click Add Destination again to add up to 5 destinations and associated schedules.
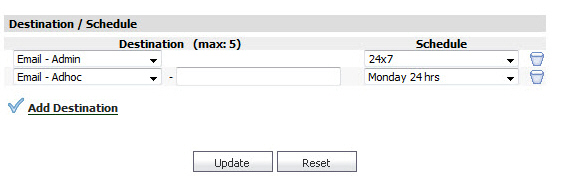
For more information on configuring Destinations, refer to the Destination / Schedule.
6. Click Update when you have finished configuring the Alert. It will be added to the list of Alerts on the menu.
You can view any currently-configured alerts by clicking Alerts > Current Alerts. A display of the current Alerts will come up.
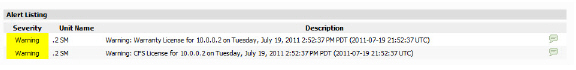
The listing will show the severity level of the Alert, the unit it applies to, and a description. Additional details can be obtained by hovering over the balloon on the right side of the column.
Custom Reports
You can configure a report with customized filters, then save it for later viewing and analysis. Saving a Report allows you to view it later, by loading it through the Custom Reports interface. Custom Reports can either be saved directly, or configured through Universal Scheduled Reports. You can either load the report through the Custom Report pull-down on the Search Bar, or click Reports > Custom and choose from the list of saved Custom reports.
Regularly scheduled Custom Reports can be configured through the Universal Scheduled Reports interface, accessible through the Custom Reports icon in the upper right corner. These reports can be set up to be emailed to you on a regular schedule.
Custom Reports are available at the unit level for all appliances visible on the Firewall tab. The Log Analyzer must be enabled for the appliance.
The Manage Reports screen (Custom Reports > Manage Reports) allows you to view what Custom Reports are available and delete reports from the system.
For more information on configuring and scheduling custom Reports refer to the Universal Scheduled Reports section.