Reporting_SRA
This section provides an introduction to the Secure Remote Access reporting feature. SonicWALL SRA appliances are protected by the user portal on the Web Application Firewall (WAF).This section contains the following subsections:
• How Does SRA Reporting Work?
After reading the Analyzer SRA Reporting Overview section, you will understand the main steps to be taken in order to create and customize reports successfully.
For a general introduction to reporting, see the Dell SonicWALL Analyzer Reporting Overview.
The SRA tab gives you access to the Secure Remote Access (SRA) Reports section of the Analyzer management interface. Reporting supports both graph and non-graph reports, and allows you to filter data according to what you wish to view.
Secure Remote Access (SRA) reporting allows you to configure and design the way you view your reports and the manner in which you receive them. This feature offers various types of static and dynamic reporting in which you can customize the way information is reported.
SonicWALL Analyzer SRA reporting provides a visual presentation of User connectivity activity, Up_Down status, and other reports related to remote access. With SRA reporting, you are able to view your reports in enhanced graphs, create granular, custom reports, create scheduled reports, and search for reports using the search bar tool.
Custom reports are also available in SRA reporting. SonicWALL appliances managed with SRA provide Resource Activity reports for tracking the source, destination, and other information about resource activity passing through a SonicWALL SRA device that can then be saved as a Custom report, for later viewing.
Custom Reports can be created through an intuitive, responsive interface for customizing the report layout and configuring content filtering prior to generating the report. Two types of reports are available: Detailed Reports and Summary Reports. Both provide detailed information, but are formatted to meet different needs. A Detailed Report displays the data in sortable, resizable columns, while a Summary Report provides top level information in graphs that you can click to drill down for detailed information. By customizing the report, you can then save it for later viewing and analysis.
Once you set up a Custom Report that meets your needs, you can save the report for later viewing, then manage it through the Custom Reports Manage Reports entry, or export the report as a PDF or CSV (Excel) file.
SRA reports provide visibility into the resource use by logged in users, leading to policies that enhance the user experience and the productivity of employees. The following capabilities contribute to the benefits of the SRA reporting feature:
• SRA Detail Level Reports can track events to the minute or second of the day for forensics and troubleshooting
• Interactive charts allow drill-down into specific details
• Table structure with ability to adjust column width of data grid
• Improved report navigation
• Report search
• Scheduled reports
Syslog information for SonicWALL remote appliances is sent to the Analyzer syslog collector and uploaded to the Reports Database by the summarizer. The frequency of upload is nearly real-time: data is uploaded to the Reports database as soon as the Syslog Collector closes the file. The file is closed and ready for upload as soon as it reaches 10,000 MB per file or if the file has been open for 3 minutes, whichever comes first.
This database is saved using a date/time suffix, and contains tables full of data for each appliance. All the syslog data received by SonicWALL Analyzer is available in the database.
SRA Reporting supports scheduled reports to be sent on a daily, weekly, or monthly basis to any specified email address.
Using and Configuring SRA Reporting
This section describes how to use and configure SRA reporting. See the following subsections:
• Viewing Available SRA Report Types
• Configuring SRA Scheduled Reports
Viewing Available SRA Report Types
To view the available types of reports for SRA Web Application Firewalls (WAF), perform the following steps:
1. Log into your Analyzer management console.
2. Click the SRA tab.
The following types of reports are available:
Global Level Reports:
• Data Usage
– Summary: connections per SRA appliance
• WAF
– Summary: connections listed by appliance for one day (default)
• General
– Status: number of units in the system and their Analyzer license status
Unit Level Reports
Clicking on hyperlinks in the Unit Level Reports takes you to the Analyzer Log, where you can view more information.
• Data Usage
– Timeline: total connections listed by hour
– Users: connections listed by user
• User Activity
– Details: a detailed report of activity for the specified user
• Access Method
– Summary: connections per connection protocol (HTTPS, NetExtender, etc)
– Users: top users by protocol
• Authentication
– User login: authenticated user logins by time and IP protocol. User Login reports combine admin users with all other users in the same report.
– Failed login: Failed login attempts with initiator IP address.
• WAF
– Timeline: total threats detected per appliance
– Threats Detected: top threats detected per day
– Threats Prevented: top threats prevented per day
– Apps Detected: top applications detected per day
– Apps Prevented: top applications blocked per day
– Users Detected: number of concurrent users per day
– Users Prevented: number of blocked users prevented per day
• Connections
– Timeline: a summary of offloaded connections under the group node per SRA appliance, listed for one day.
– Applications: offloaded connections by application
– Users: offloaded connections by user
• Analyzers
– Log Analyzer: logs of all activity
• Configuration: menus allow setting Report display options
– Log Analyzer Filter: applies filters to the system logs uploaded to the reporting database
• Events: these menus allow setting options
– Alert Settings: provides search functions, adding or removing Alerts
– Current Alerts: displays current applicable Alerts.Custom
Note: You can use the Date Selector to select reports covering other intervals than those listed here.
Configuring SRA Scheduled Reports
SRA reports are scheduled through the Universal Scheduled Reports interface. Additionally, you can configure alerts and filter the syslog.
To configure SRA scheduled reports and summarization, click on the Schedule Report icon. The Universal Schedule Report menu comes up. For more information on scheduling and configuring reports, refer to the section on Universal Scheduled Reports.
Navigating Through Detailed SRA Reports
SRA reports display either summary or unit views, displayed in a Data Container. Information can be viewed in either chart (timeline or pie chart) form, or tabular (grid) format. The list of available reports allows you to navigate to a high-level or specific view. Data can be filtered by time constraints or data filters.
Drillable reports give access to additional information by clicking on hyperlinks to go to the Detail view. For some reports, you can go directly to the detail views by clicking Details in the Policies/Reports pane.
Data filtering can be applied either by using the Filter Bar, drilling down through hyperlinked data, or applying a filter to a drillable data column.
The SRA group level Summary report displays all SRA interfaces under that group level node, along with the total number of threats detected on the specified day.
The SRA Summary report is available for Data Usage, Web Application Firewall (WAF), and Connections. It shows the number of connections handled by the SRA appliances on the specified day or interval. The grid-level reports lists each appliance by name, along with the number of connections. To view the Data Usage Summary report, perform the following steps:
1. Click the SRA tab.
2. Select the global icon.
3. Expand the Data Usage, WAF, or Connections tree and click Summary. The Summary page displays.
For more information, click on an individual appliance in the TreeControl menu. More settings, as well as more detailed information, is available at the Unit View level.
Viewing SRA Unit-Level Reports
Unit View reports provide detail about Data Usage, Access Method, Authentication, WAF Access, Connections, and Uptime and Downtime. You can also view the results from the Analyzers or saved Custom Reports.
Viewing Unit-Level Data Usage Reports
1. Click the SRA tab.
2. Select the desired Unit.
3. Expand the Data Usage entry and click Timeline to display the Report.
4. The graph displays the number of connections to the selected SRA appliance during the desired interval. The current 24 hours is displayed by default.
The timeline contains the following information:
• Hour—when the sample was taken.
• Connections—number of connections to the SRA appliance
5. To change the interval of the report, use the left arrow to click back a day at a time, or click on the Time Bar to access the Interval menu pull-down calendar.
6. After selecting a date, click Search. The Analyzer Reporting Module displays the report for the selected day.
Note The date setting will stay in effect for all similar reports during your active login session.
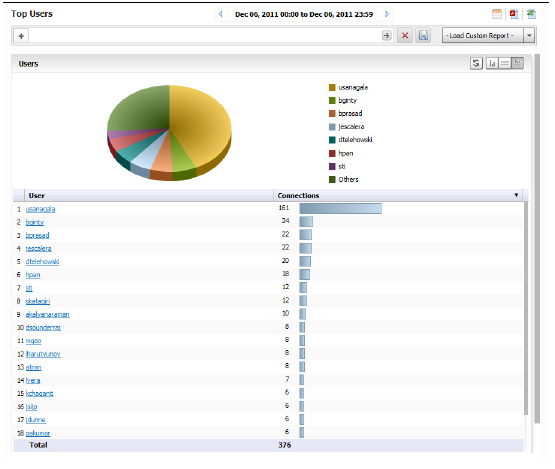
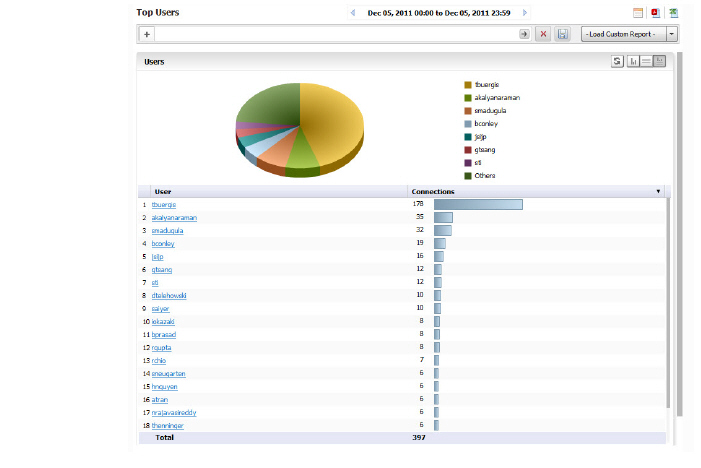
The Top Users report displays the users who used the most connections on the specified date.
To view the Top Users report, perform the following steps:
1. Click the SRA tab.
2. Select the SRA appliance.
3. Expand the Data Usage tree and click Users. The Top Users page displays.
4. The pie chart displays the percentage of connections used by each user.
The table contains the following information for all users:
• Users—the user name
• Connections—number of connection events or “hits”
By default, the Analyzer Reporting Module shows yesterday’s report, a pie chart for the top six users, and a table for all users. To change the date of the report, click the Start field to access the pull-down calendar.
5. To display a limited number of users, use the Search Bar fields.
Note This report allows you to drill down by user. Clicking on a user in either the chart or grid view will take you to the Log Analyzer.
Viewing User Activity Logs
Web User Activity logs allow you to filter results to view only the activity of a specific user.
The User Activity Analyzer provides a detailed report listing activity filtered by user. If a user report has been saved previously, bringing up the User Activity Analyzer will display a list of saved reports under the Filter Bar.
If you wish to create a new report, use the Filter Bar to create a new report.
1. Click the Firewall tab.
2. Select a SonicWALL appliance.
3. Click on User Activity > Details to bring up the User Activity Analyzer. The User Activity Analyzer generates a Detail report based on the user name.
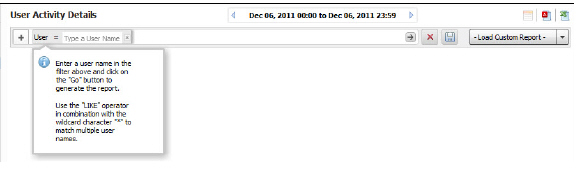
If no user activity reports were saved, only the Filter Bar will display, with the User filter pre-selected. You can enter a specific user name, or use the LIKE operator wildcards (*) to match multiple names.
4. Enter the name of the user into the field and click the Go (arrow) button to generate the report
The customized User Activity Details report will display a timeline of events, Initiators, Responders, Services, Applications, Sites visited, Blocked site access attempted, VPN access policy in use, user authentication, Intrusions, Initiator Countries, and Responder Countries associated with that particular user.
Data for a particular user may not be available for all of these categories.
Access Methods provide an overview of the protocols used to access the net. They are available as a summary pie chart or in a Top User report, both of which provide additional information on the access protocol of the specified user through the Log Analyzer.
Viewing the Access Summary Report
The Access Summary report provides an overview of the types of access protocols used. Clicking on a hyperlinked protocol entry will take you to the Log Analyzer view for more details.
To view the Summary Report:
1. Click the SRA tab.
2. Select a SRA appliance.
3. Expand the Access Method tree and click Summary. The Access Method Summary page appears.
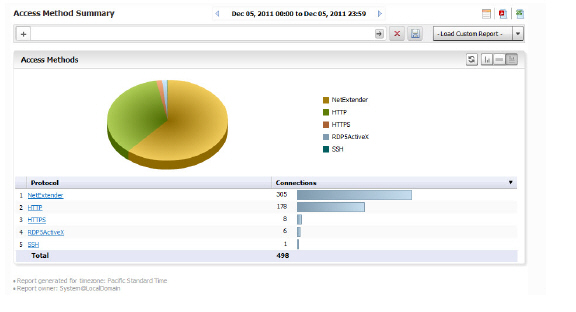
4. Click on a section of the pie chart to obtain more details, or hover the mouse over an item on the Protocol column and right click Add Filter to narrow the results to a particular access protocol. The results will display in the Log Analyzer report.
Viewing the Top Users Access Report
1. Click the SRA tab.
2. Select a SRA appliance.
3. Expand the Access Method tree and click Users. The Top Users report appears.
In the chart view, you can click on either the pie chart or user list to obtain more information from the Log Analyzer. Results will be filtered by user, and the setting added to the filter bar.
Alternatively, you can hover your mouse over a user in the User column of the grid view, then right click to filter results. For full details on that user, drill down by clicking on the user name in the column.
Viewing SRA Authentication User Login Report
The Authentication Summary report shows an overview of user logins and login attempts and disconnections by time, user, IP address, type of connection/disconnection, and amount of time the connection was established. Authentication reports are only available at the unit level.
1. Click the SRA tab.
2. Select a SRA appliance.
3. Expand the Authentication tree and click User Login. The Authenticated User Login report appears.
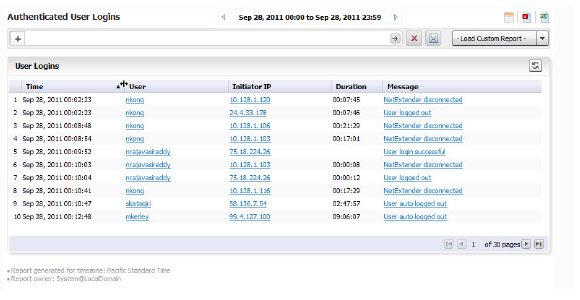
Note All reports appear in the appliance’s time zone.
The user login report shows the login for users that logged on to the SRA appliance during the specified day.
The Report contains the following information:
• Time—the time that the user logged in
• User—the user name
• Initiator IP—the IP address of the user’s computer
• Message—the type of connection/disconnect
• Duration—the duration of the user login session
Viewing SRA Authentication Failed Login Report
The Authentication Failed Login report shows an overview of user logins and login attempts and disconnections by time, user, IP address, type of connection/disconnection, and amount of time the connection was established. Authentication reports are only available at the unit level.
1. Click the SRA tab.
2. Select a SRA appliance.
3. Expand the Authentication tree and click User Login. The Authenticated User Login report appears.
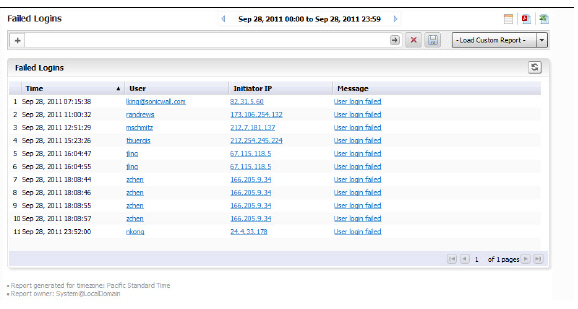
Note All reports appear in the appliance’s time zone.
The failed login report shows the login attempts for users that attempted to log on to the SRA appliance during the specified day.
The Report contains the following information:
• Time—the time that the user logged in
• User—the user name
• Initiator IP—the IP address of the user’s computer
• Message—about the type of failed attempt
Viewing Web Application Firewall (WAF) Reports
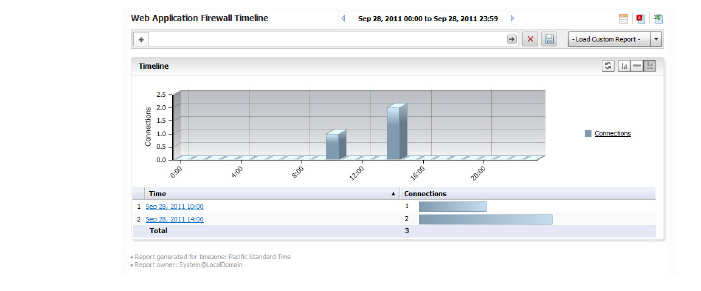
The Web Application Firewall (WAF) Summary report contains information on the number of connections incurring Application Firewall activity logged by a SonicWALL appliance during each hour of the specified day, or at the global level, for all SonicWALL appliances for the day.
The Web Application Firewall provides the following Reports:
• Timeline
• Threats Detected
• Threats Prevented
• Apps Detected
• Apps Prevented
• Users Detected
• Users Prevented
Clicking on hyperlinks in these reports take you to the Log Analyzer view, for more details.
To view reports:
1. Click on the SRA tab and either GlobalView for the group or by individual appliance in the TreeControl view on the left tab of the interface.
2. Click Reports on the middle tab.
3. Select the WAF entry to expand it and click on the Report you want to view.
Viewing Connections Timeline
The WAF Connections timeline displays connections to the web firewall over time.To view the Web Application Firewall Summary report, perform the following steps:
1. Click the SRA tab.
2. Select a SonicWALL appliance.
3. Click Connections > Timeline
The Timeline displays the unit level summary report containing Offloaded Connections information for an individual SRA system.
Click on the hyperlinks available in this report to go to the Log Analyzer.
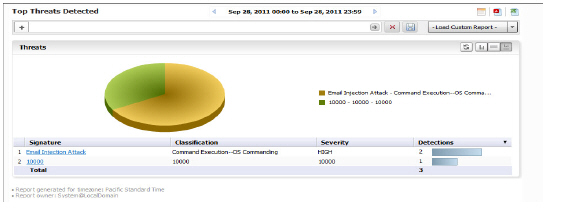
Viewing WAF Top Threats Detected
The Threats Detected report displays the threats detected, according to signature, classification, and severity. To view the Web Application Firewall Top Threats Detected report, perform the following steps:
1. Click the SRA tab.
2. Select a SonicWALL appliance.
3. Click on the Reports tab.
4. Click WAF > Threats Detected.
The Top Threats Detected screen shows the top threats detected by the firewall, and gives details on the Threat Signature, Threat Classification, Threat Severity, in addition to total threats detected.
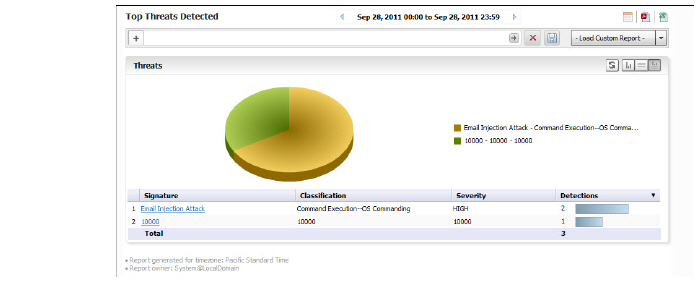
Click on the hyperlinks available in this report to go to the Log Analyzer.
Viewing WAF Top Threats Prevented
To view the Web Application Firewall Top Threats Prevented report, perform the following steps:
1. Click the SRA tab.
2. Select a SonicWALL appliance.
3. Click on the Reports tab.
4. Click WAF > Threats Prevented.
The Top Threats Prevented view shows Top Threats detected and prevented by the web firewall, with details on the Threat Signature, Threat Classification, Threat Severity, in addition to total threats detected.
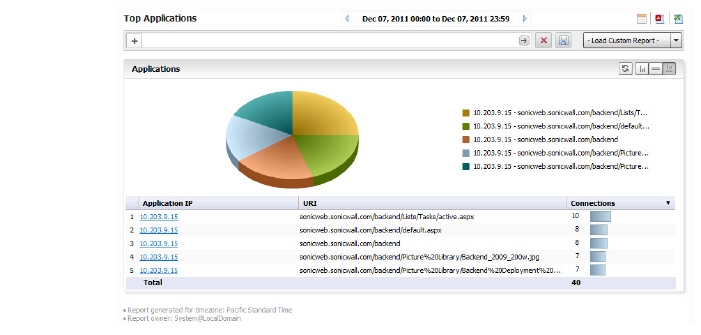
Viewing WAF Top Applications Detected
To view the Web Application Firewall Top Applications Detected report, perform the following steps:
1. Click the SRA tab.
2. Select a SonicWALL appliance.
3. Click on the Reports tab.
4. Click WAF > Applications Detected.
The Top Applications Detected report will list applications with the most number of threats detected by the WAF process. It will display the Application IP, URI and the Detections in order of the number of detections.
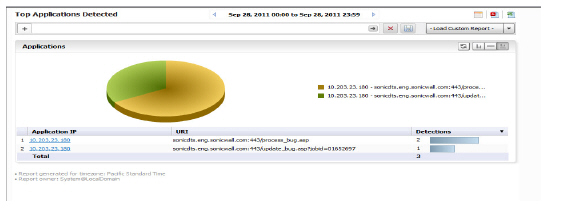
Click on the hyperlinks available in this report to go to the Log Analyzer.
Viewing WAF Top Applications Prevented
To view the Web Application Firewall Top Applications Detected report, perform the following steps:
1. Click the SRA tab.
2. Select a SonicWALL appliance.
3. Click on the Reports tab.
4. Click WAF > Applications Detected.
The Top Applications Prevented report will list applications with the most number of threats prevented by the Web Application Firewall. It will display the Application IP, URI and the preventions in order of the number of threats prevented by the firewall
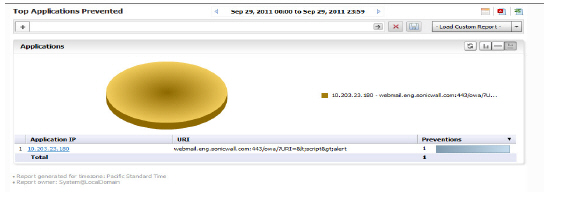
Click on the hyperlinks available in this report to go to the Log Analyzer.
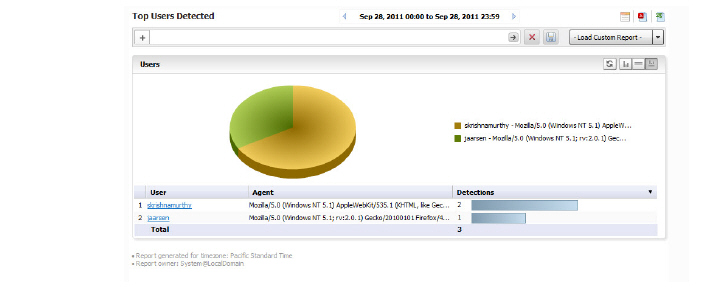
Viewing WAF Top Users Detected
The Top Users Detected report will list the top authenticated users from whom threats have been detected by the Web firewall. It will display the User Name, User Agent and the Detections in order of the number of detections.
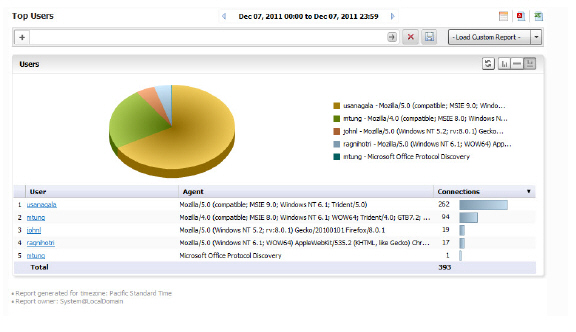
The Top Users report displays the users who made the most VPN connections on the specified date.
To view the Top Users report, perform the following steps:
1. Click the SRA tab.
2. Select a SonicWALL appliance.
3. Click on the Reports tab.
4. Click WAF > Users Detected. The Top Users page displays.
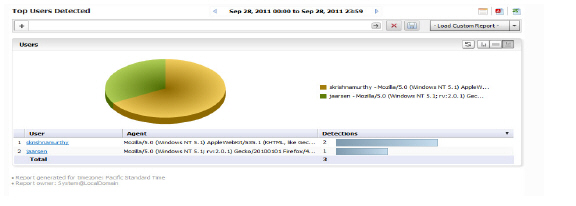
5. The pie chart displays the VPN connections for the top VPN users.
6. The table contains the following information by default:
– Users—the user’s login. You can drill down to learn the IP address of the user.
– Agent - the User agent and version being used.
– Detections—the number of VPN connections in order of number of detections.
– MBytes—the number of megabytes transferred.
7. By default, the Analyzer Reporting Module shows yesterday’s report, a pie chart, and the ten top users. To change the date of the report, use the Search Bar and click the Start or End field to access the pull-down calendar, or click More Options for report display settings.
Viewing WAF Top Users Prevented
To view the Web Application Firewall Top Users Prevented report, perform the following steps:
1. Click the SRA tab.
2. Select a SonicWALL appliance.
3. Click on the Reports tab.
4. Click WAF > Users Prevented.
The Top Users Prevented report lists the top authenticated users from whom threats have been prevented by the SonicWALL web firewall. It displays their user name, user agent, and preventions, in order of the number of preventions.
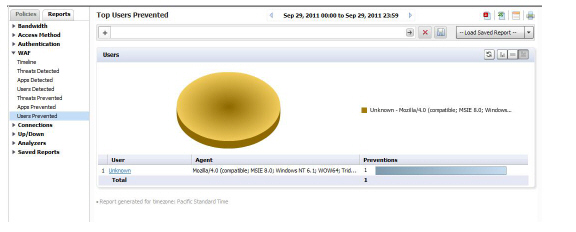
Click on the hyperlinks available in this report to go to the Log Analyzer.
Connection reports show the number of connections, as well as throughput data, application and user data.
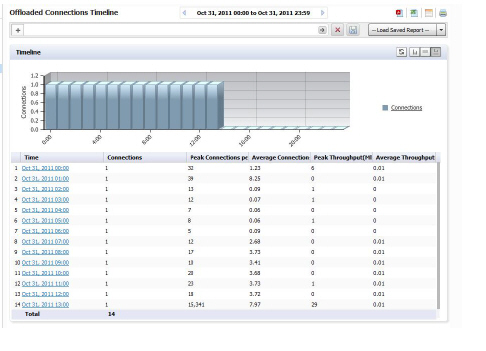
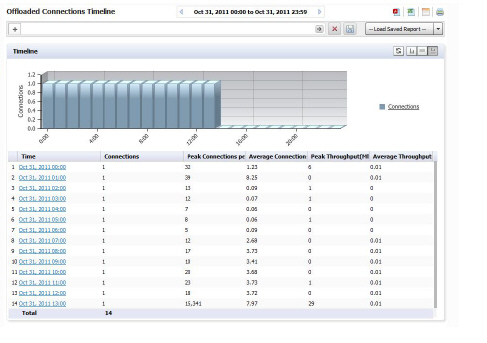
Viewing the Offloaded Connection Timeline
The Offloaded Connection Summary report lists the total connections made for all offloaded applications for one day, displayed per hour per day. The grid section displays peak connections per second, peak throughput, average connections per second, and average throughput per hour.
To view the Offloaded Connections Timeline report, perform the following steps:
1. Click the SRA tab.
2. Select a SonicWALL appliance.
3. Click on the Reports tab.
4. Click Connections > Timeline.
The Offloaded Connections Summary report displays.
Viewing the Offloaded Connections Top Applications Report
The Top Applications report lists those applications having the most offloaded connections, as well as information about the application and throughput.
To view the report:
1. Click the SRA tab.
2. Select a SonicWALL appliance.
3. Click on the Reports tab.
4. Click Connections > Applications.
The report displays the IP address of the application, the URI, and how many connections were established. The report is drillable on the application IP address to obtain the Log Analyzer report.
Viewing the Offloaded Connections Top Users Report
The Top Users report lists the users who have the most offloaded connections It displays the User Name, User agent, and connections, in order of number of offloaded connections. The report will drill down to the Top Applications, filtered by User Name.
To view the report:
1. Click the SRA tab.
2. Select a SonicWALL appliance.
3. Click on the Reports tab.
4. Click Connections > Users.
The report will drill down to the Top Applications, filtered by User Name.
Analyzer logs contain detailed information from the system logs on each transaction that occurred on the SRA appliance.
The Log Analyzer allows advanced users to examine raw data for status and troubleshooting information. The Analyzer logs contain detailed information from the system logs on each transaction that occurred on the specified SonicWALL appliance. These logs can be filtered or drilled down to further narrow the focus of the information, allowing analysis of data about alerts, traffic, bandwidth consumption, etc. The Log Analyzer is only available at the individual unit level.
The SRA Log Analyzer contains information about Initiator and Responder IP addresses, Status Messages, User and Services used, as well as the time and duration of the session.
You can filter the log on IP address, Message, User, or Service.
Clicking hyperlinks on SRA Reports takes you the Analyzer Log view of the information. Log information can be saved by using the Save icon on the Filter Bar for a specific report. This report will then Appear in the list of Custom Reports.
For more information on the Log Analyzer, refer to Using the Log Analyzer.
Saving System Log Reports
To load the report for later viewing, either:
• Click Load Custom Report and select from the pull-down list of saved Custom reports.
• Click on Analyzers > Log Analyzer
Note The Log Analyzer entries display raw log information for every connection. Depending on the amount of traffic, this can quickly consume a large amount of space in the database. It is highly recommended to be careful when choosing the number of days of information that will be stored. For more information, see Configuring SRA Scheduled Reports and Universal Scheduled Reports.
You can also click on the print icon to save a log to PDF of Excel format.
Note: Saved system logs are limited in the number of rows that will be saved. If saving to PDF, a maximum of 2500 rows will be saved. If saving to Excel, a maximum of 10,000 rows will be saved.
Viewing the Analyzer Log for a SRA Appliance
To view the Log, perform the following steps:
1. Click the SRA tab.
2. Select a SRA appliance.
3. Expand the Analyzer tree and click on Log Analyzer. The saved Log report page displays.
Filters allow you to fine-tune what information is displayed in Reports. Filters allow you to narrow search results and view subsets of report data.
Use this screen to manage the volume of syslog uploaded to the reporting database. The factory default filters are configured to upload only the syslog needed to generate the reports. This can be fine tuned further, but it required advanced knowledge of the syslog and consequently should be performed by experts only. Adding a wrong filter could lead to receiving a Report Could Not Be Generated message.
1. To add a filter, click on Configuration > Filters.
The Syslog Exclusion Filter page comes up. This page allows you to view filters currently applied, add filters, or remove filters.
2. To configure and add a filter, click Add Filter. The Add Filter menu comes up.

3. Specify the field you want to modify, and select an operator and value. Click Update.
You can configure a report with customized filters, then save it for later viewing and analysis. Saving a Report allows you to view it later, by loading it through the Custom Reports interface. Custom Reports can either be saved directly, or configured through the Universal Scheduled Reports. You can either load the report through the Custom Report pull-down on the Search Bar, or click Reports > Custom and choose from the list of saved Custom reports.
Custom Reports are available at the unit level for all appliances visible on the SRA tab. The Log Analyzer must be enabled for the appliance.
The Manage Reports screen (Custom Reports > Manage Reports) allows you to view what Custom Reports are available and delete reports from the system.

For more information on Custom Reports, refer to the Custom Reports.