 A second method involves clicking the Switch icon. While logged into either interface, you can switch to the login page of the other interface by clicking the Switch button in the top right corner of the page.
Introduction_to_SonicWALL_Analyzer
Monitoring critical network events and activity, such as security threats, inappropriate Web use, and bandwidth levels, is an essential component of network security. Dell SonicWALL Analyzer Reporting complements SonicWALL's network security offerings by providing detailed and comprehensive reports of network activity.
The Analyzer Reporting Module is a software application that creates dynamic, Web-based network reports. The Analyzer Reporting Module generates both real-time and historical reports to offer a complete view of all activity through SonicWALL network security appliances. With Analyzer Reporting, you can monitor network access, enhance security, and anticipate future bandwidth needs. The Analyzer Reporting Module:
• Displays bandwidth use by IP address and service
• Identifies inappropriate Web use
• Provides detailed reports of attacks
• Collects and aggregates system and network errors
• Shows VPN events and problems
• Presents visitor traffic to your Web site
• Provides detailed daily logs to analyze specific events.
The Dell SonicWALL Analyzer comes with a base license to manage either 5, 10, or 25 nodes. You can purchase additional licenses on MySonicWALL. For more information on licensing additional nodes, visit:
http://www.sonicwall.com/us/Products_Solutions.html
Note Global Management System is not supported on laptops or tablets.
Before installing, review the requirements in the following sections:
The Dell SonicWALL Analyzer supports the following operating systems:
• Windows Server 2008 SBS R2 64-bit
• Windows Server 2008 R2 Standard 64 bit
• Windows Server 2008 SP2 64-bit
• Windows Server 2003 64-bit (SP2)
• Windows 7 SP1 64-bit
Tip In all instances, Dell SonicWALL Analyzer is running as a 32-bit application. Bundled databases run in 64-bit mode on 64-bit Windows operating systems. All listed operating systems are supported in both virtualized and non-virtualized (VMware ESXi 4.1) environments.
The Dell SonicWALL Analyzer requires the following hardware:
• x86 Environment: minimum 3 GHz processor dual-core CPU Intel processor
• 4GB RAM minimum
• 300 GB disk space
A Windows 64-bit operating system with a minimum RAM of 8-GB is highly recommended for better performance of reporting modules. Please read the Capacity Planning and Performance Tuning appendix in the GMS 7.1 Administrator’s Guide.
Dell SonicWALL Analyzer automatically installs MySQL as part of the base installation package. Separately installed instances of MySQL are not supported with Analyzer 7.1 Software.
Download and install the latest version of the Java 7 plug-in on any system that accesses the GMS 7.1 UI. This can be downloaded from www.java.com or http://www.oracle.com/technetwork/java/javase/downloads/index.html
Browser Requirements
• Microsoft Internet Explorer 8.0 or higher (Do not use Compatibility Mode)
Note Internet Explorer version 10.0 in Metro interfaces of Windows 8 is currently not supported.
• Mozilla Firefox 16.0 or higher
• Google Chrome 18.0 or higher (recommended browser for dashboard real-time graphics display)
To complete the Global Management System deployment process documented in this Getting Started Guide, the following network requirements must be met:
• The Dell SonicWALL Analyzer server must have access to the Internet
• The Dell SonicWALL Analyzer server must have a static IP address
• The Dell SonicWALL Analyzer server’s network connection must be able to accommodate at least 1 KB/s for each device under management. For example, if Global Management System is monitoring 100 SonicWALL appliances, the connection must support at least 100 KB/s.
CAUTION Depending on the configuration of Dell SonicWALL log settings and the amount of traffic handled by each device, the network traffic can vary dramatically. The 1 KB/s for each device is a general recommendation. Your installation requirements may vary.
Dell SonicWALL Appliance and Firmware Support
| ||||||||||||||||||||||||||
Dell SonicWALL Analyzer Installation
Analyzer can be installed as a fresh install or as an upgrade to SonicWALL ViewPoint 6.0 and above. Beginning in SonicWALL ViewPoint 5.1, all software components related to Dell SonicWALL Analyzer and SonicWALL Global Management System (GMS), including the MySQL database, executable binary files for all services, and other necessary files, are installed using the Universal Management Suite (UMS) single-binary installer. All SonicWALL Analyzer and SonicWALL GMS files are installed as part of the Universal Management Suite, but no distinction is made between SonicWALL Analyzer and SonicWALL GMS during the installation. The initial installation phase takes just a few minutes for any type of installation, such as a SonicWALL Analyzer server, a SonicWALL GMS server, a database server, or any other role.
To install the Universal Management Suite from the single binary installer, refer to the Dell SonicWALL Analyzer Getting Started Guide.
License and Registration Requirements
SonicWALL Analyzer is registered and licensed from the Windows server on which it is installed. Dell SonicWALL Analyzer registration is performed using the SonicWALL Universal Management Host system interface.
Refer to the Dell SonicWALL Analyzer Getting Started Guide for detailed instructions on registering and licensing Analyzer on your system.
On Dell SonicWALL appliances that send reporting data to the Analyzer, Analyzer is licensed and activated separately from the Dell SonicWALL appliances. MySonicWALL provides a way to associate Dell SonicWALL appliances with the Analyzer instance installed on the Windows system. Licensing your Analyzer application on a Dell SonicWALL appliance requires:
• A MySonicWALL account. A MySonicWALL account allows you to manage your SonicWALL products and purchase licenses for various services. Creating a MySonicWALL account is fast, simple, and free. Simply complete an online registration form directly from your SonicWALL security appliance management interface. Your MySonicWALL account is also accessible at
<https://www.mysonicwall.com> from any Internet connection with a Web browser. Once you have an account, you can purchase SonicWALL Analyzer and other licenses for your registered SonicWALL security appliances.
• A registered SonicWALL security appliance with active Internet connection. You need to register your SonicWALL security appliance to activate SonicWALL Analyzer. Registering your SonicWALL security appliance is a simple procedure done directly from the management interface. Once your SonicWALL security appliance is registered, you can activate SonicWALL Analyzer by using an activation key or by synchronizing with mysonicwall.com.
Accessing the Correct Management Interface
Dell SonicWALL Analyzer includes two separate management interfaces:
• SonicWALL Universal Management Host (UMH) System Management Interface – Used for system management of the Dell SonicWALL Analyzer instance, including registration and licensing, setting the admin password, creating backups, restarting the system, configuring network settings, selecting the deployment role, and configuring other system settings.
Access the system management interface with the URL:
http://<IP_address>:<port_number>/appliance/
If you are using the standard HTTP port, 80, it is not necessary to append the port number to the IP address. If you are accessing the interface from the same system on which it is installed, use the following URL:
http://localhost/appliance/
• Dell SonicWALL Analyzer Management Interface – Used to access the Dell SonicWALL Analyzer application that runs on the system. This interface is used to configure and view Dell SonicWALL Analyzer reporting on SonicWALL appliances and for configuring Dell SonicWALL Analyzer administrative settings. Access the Dell SonicWALL Analyzer management interface with one of the following URLs:
http://<IPaddress>:<port_number>/sgms/
http://localhost/sgms/
Switching Between Management Interfaces
You can easily switch between the SonicWALL UMH system management interface and the Dell SonicWALL Analyzer application management interface.
One method is to change the URL by adding /sgms for the Analyzer application interface or adding /appliance for the UMH interface.
A second method involves clicking the Switch icon. While logged into either interface, you can switch to the login page of the other interface by clicking the Switch button in the top right corner of the page.
After registering your SonicWALL Analyzer product, to login into the SonicWALL Analyzer management interface, either double-click on the SonicWALL Analyzer icon on your desktop, or from a remote system, access the following URL from a web browser:
http://<IP_address>:<port_number>
The Dell SonicWALL Analyzer login page appears by default in English. To change the language setting, click your language of choice at the bottom of the login page. The available language choices for SonicWALL Analyzer include English, Japanese, Simplified Chinese, and Tradition Chinese.
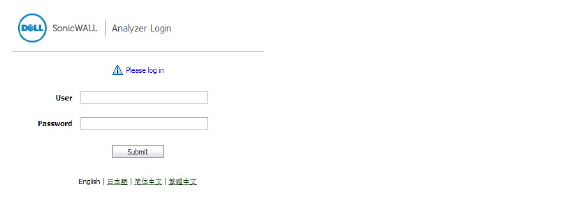
1. Enter the SonicWALL user ID (default: admin) and password (default: password). Select ‘Local Domain’ as the domain (default).
2. Click Submit. The Dell SonicWALL Analyzer management interface displays.
Note For more information on installation, login procedures, and registration of your SonicWALL Analyzer installation, please refer to the appropriate Getting Started Guide, available at: <http://www.sonicwall.com/us/support.html>
Navigating the Analyzer User Interface
This section describes the Firewall, SRA, and Console panels in the SonicWALL Analyzer user interface. For information about the Dashboard panel, see the Using the Universal Scheduled Reports Application.
The Firewall Panel is an essential component of network security that is used to view and schedule reports about critical network events and activity, such as security threats, inappropriate Web use, and bandwidth levels. To open the Firewall Panel, click the Firewall tab at the top of the Analyzer user interface.
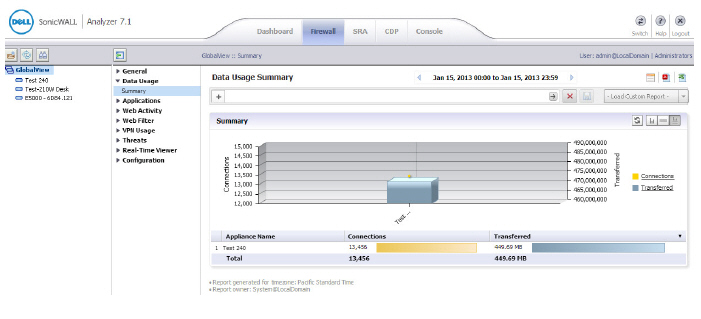
From the Firewall Panel, you can view the following for connected SonicWALL appliances:
• View general unit status, license status, and syslog settings.
• View the SonicWALL security dashboard. Dashboard reports display an overview of bandwidth, uptime, intrusions and attacks, and alerts for connected SonicWALL firewall appliances. The Security Dashboard report provides data about worldwide security threats that can affect your network. The Dashboard also displays data about threats blocked by the SonicWALL security appliance.
• View custom reports of Internet activity or Website filtering at the unit level. Custom reports filter raw syslog data and you can specify start and end dates or a date range such as “Week to date”. You can filter by user, domain, protocol, traffic, and full URL categories, depending on the type of custom report. The search template can be saved for use again later with the same appliance.
• View general bandwidth usage. These reports include a daily bandwidth summary report, a top users of bandwidth report, and over-time summary and top users reports.
• View a services report. This report includes information about events and usage of protocols and megabytes.
• View Web bandwidth usage. These reports include a daily bandwidth summary report, a top visited sites report, a top users of Web bandwidth report, a report that contains the top sites of each user, and a weekly summary report.
• View the number of attempts that users made to access blocked websites. These reports include a daily summary report, a top blocked sites report, a top users report, a report that contains the top blocked sites of each user, and a weekly summary report.
• View file transfer protocol (FTP) bandwidth usage. These reports include a daily FTP bandwidth summary report, a top users of FTP bandwidth report, and a weekly summary report.
• View mail bandwidth usage. These reports include a daily mail summary report, a top users of mail report, and a weekly summary report.
• View VPN usage. These reports include a daily VPN summary report, a top users of VPN bandwidth report, and a weekly summary report.
• View reports on attempted attacks and errors. The attack reports include a daily attack summary report, an attack by category report, a top sources of attacks report, and a weekly attack summary report. The error reports include a daily error summary report and a weekly error summary report.
• View reports on attempted virus attacks. Virus attacks reports are available for appliances that are licensed for SonicWALL Gateway Anti-Virus. These reports include the most frequent virus attack attempts, virus attacks by top destinations, virus attacks over time, virus attacks over a period of time, and virus attacks by top destinations over time.
• View reports on attempted spyware attacks. Anti-spyware reports are available for appliances that are licensed for SonicWALL Anti-Spyware. These reports include spyware attacks by category, spyware attacks over time, and spyware attacks by category over time.
• View reports on attempted intrusion attacks. Intrusion prevention reports are available for appliances that are licensed for SonicWALL Intrusion Prevention Service. These reports include intrusion attacks by source IP address, intrusion attacks by category, intrusion attacks over time, and intrusion attacks by category over time.
• View reports on traffic triggering Application Firewall policies. Application Firewall reports are available for SonicWALL firewall appliances that are licensed for SonicWALL Application Firewall. These reports include summary, over time, top applications, top users, and top policies.
• View successful and unsuccessful user and administrator authentication attempts. These reports include a user authentication report, an administrator authentication report, and a failed authentication report.
• View detailed logging information. The detailed logging information contains each transaction that occurred on the SonicWALL appliance.
• View current alerts and access alert settings.
The SRA panel provides access to SSL VPN appliances and is similar to the Firewall panel. It is used to view and schedule reports about critical network events and activity, such as security threats, inappropriate Web use, and bandwidth levels. To open the SRA Panel, click the SRA tab at the top of the Analyzer user interface.
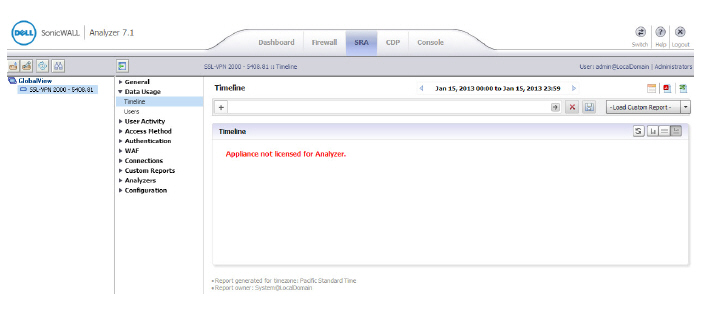
From the SRA Panel, you can view the following for connected SonicWALL SSL VPN appliances:
• View general unit status, license status, and syslog settings.
• View general bandwidth usage. These reports include a daily bandwidth summary report, a top users of bandwidth report, and over-time summary and top users reports.
• View custom reports of custom reports of resource activity at the unit level. Custom reports filter raw syslog data and you can specify start and end dates or a date range such as “Week to date”. You can filter by user, protocol, destination IP, and source IP categories. The search template can be saved for use again later with the same appliance.
• View a resources report. This report includes information about connections and the resource used to connect, such as HTTPS or NetExtender.
• View successful and unsuccessful user authentication attempts. These reports include a user authentication report and a failed authentication report.
• View detailed logging information. The detailed logging information contains each transaction that occurred on the SonicWALL appliance.
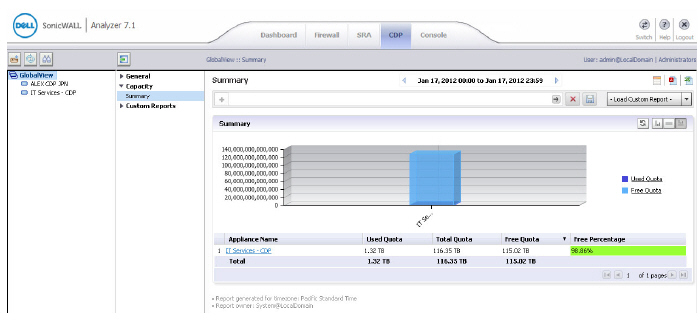
The CDP panel provides access to CDP appliances and is similar to the SRA panel. It is used to view and schedule reports about storage capacity, used quota, and free quota. To open the CDP Panel, click the CDP tab at the top of the Analyzer user interface.
The Console Panel is used to configure Dell SonicWALL Analyzer settings, view pending tasks, view the log, manage licenses, and configure alerts. To open the Console Panel, click the Console tab at the top of the Dell SonicWALL Analyzer user interface.
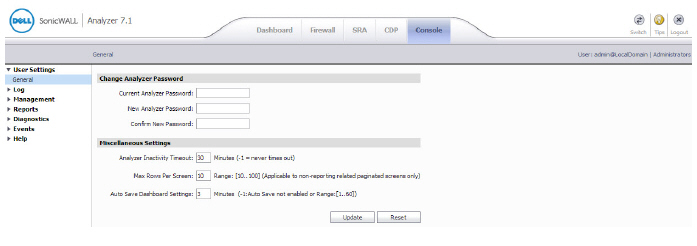
From the Console Panel, you can do the following:
• Change the Dell SonicWALL Analyzer password, adjust the amount of inactive time before the user is automatically logged out of Analyzer, and set the maximum number of rows displayed on paginated screens.
• Configure Web sites and Web users that will be excluded from Web usage reports.
• View the Dell SonicWALL Analyzer log and delete old log messages. The Dell SonicWALL Analyzer log contains information on alert notifications, failed Dell SonicWALL Analyzer login attempts, and other events that apply to Dell SonicWALL Analyzer.
• Manage SMTP settings, system email addresses, archive report settings, debug level for logs, and password security settings. You can set the schedule and server settings, and the email alert recipient schedule and preferred format.
• Manage login sessions. You can view the status of user sessions and, if necessary, end them.
• Configure report settings for sort options and maximum units with Log Viewer enabled. Enabling Log Viewer allows custom reports for the system, but is resource intensive.
• Control summarizer settings, syslog and summarized data deletion schedules, and host name resolution settings.
• Configure email archive settings and search settings for scheduled reports, and manage data archiving.
• View summarizer diagnostics, useful for capacity planning.
• Configure granular event management report settings, including threshold, schedule, and alert settings.
• Configure Web services deployment settings and view Web services status.
• View the version number, serial number, and database information for SonicWALL Analyzer, and access links to all available tips and video tutorials.
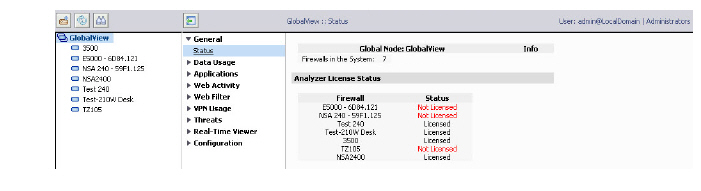
SonicWALL Analyzer allows you to view status and reports for all appliances at once using GlobalView, or for a single unit at a time with the Unit view. Analyzer provides status information on the General > Status page of the Firewall, SRA, or CDP panel.
GlobalView is a grouping of all the appliances you are monitoring with Analyzer. From the GlobalView of the Firewall, SRA, or CDP panel, Summary and Over Time reports are available for all SonicWALL appliances monitored by SonicWALL Analyzer.
To open the My Reports view, click the GlobalView icon at the top of the left pane. To display the global status page, navigate to General > Status.
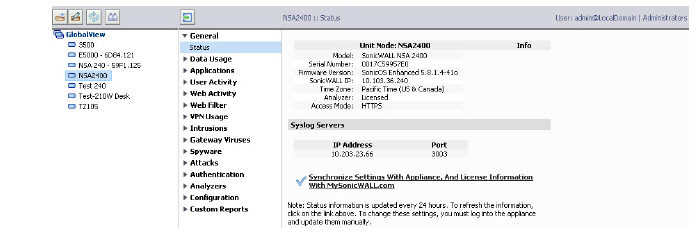
From the Unit view, reports contain detailed data for the selected SonicWALL appliance. To specify the unit view, click any unit in the left pane. To display the unit status page, navigate to General > Status on the Firewall, SRA, or CDP panel.
This section describes the meaning of icons that appear next to managed appliances listed in the left pane of the Analyzer management interface.
|
Using the Analyzer TreeControl Menu
This section describes the content of the TreeControl menu within the Dell SonicWALL Analyzer user interface.
You can control the display of the TreeControl pane by selecting one of the appliance tabs at the top of the main window. For example, when you click the Firewall tab, the TreeControl pane displays all the connected SonicWALL firewall appliance units. The two appliance tabs can display the following appliance types when Analyzer is monitoring these device types:
• SonicWALL firewall appliances
• SRA and EX-Series SRA appliances
You can hide the entire TreeControl pane by clicking the sideways arrow icon, and redisplay the pane by clicking it again. This is helpful when viewing some reports or other extra-wide screens.
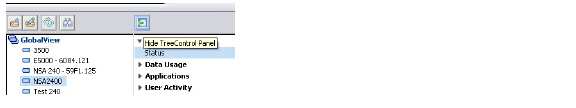
To open a TreeControl appliance menu, right-click GlobalView or a Unit icon.
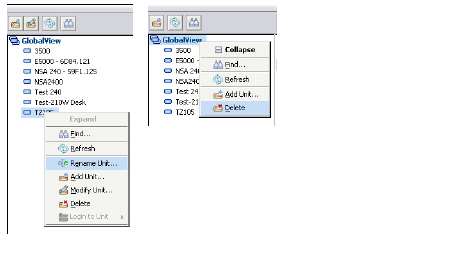
The following options are available in the right-click menu:
• Find – Opens a Find dialog box that allows you to search for units.
• Refresh – Refreshes the Analyzer UI display.
• Rename Unit – (unit view only) Renames the selected SonicWALL appliance.
• Add Unit – Add a new unit to the Analyzer view. Requires unit IP and login information.
• Modify Unit – (unit view only) Change basic settings for the selected unit, including unit name, IP and login information, and serial number.
• Delete – Delete the selected unit
• Login to Unit – (unit view only) Login to the selected unit using HTTP or HTTPS protocols.

