Reporting : Firewall Reporting Overview

Viewing Unit Level Status Reports
Unit level reports display status for an individual SonicWALL appliance. From this information, you can locate trouble spots within your network, such as a SonicWALL appliance that is having network connectivity issues caused by the ISP. You can also monitor web usage, including attempts to reach filtered sites, as well as incoming attacks on your network.
Viewing Data Usage Reports
The default Data Usage report displays a timeline for hours that the selected SonicWALL appliance was online and functional during the time period with connections, transferred connections, and cost displayed.
1
Click the Reports tab.
2
Click Data Usage > Timeline. (This is the default view when the Firewall Report interface comes up.)
 
This report is drillable. Click on an Initiator IP entry to break the Timeline report down into its Detail View report groups for the selected IP address. These groups also contain drillable hyperlinks that takes you to more specific Detail View information. The columns can also be filtered. For more information on drilling down in a report, refer to Drilling Down
The following Section entries are available:
Viewing User Activity Logs
Web User Activity logs allow you to filter results to view only the activity of a specific user.
The User Activity Analyzer provides a detailed report listing activity filtered by user. If a user report has been saved previously, bringing up the User Activity Analyzer displays a list of saved reports under the Filter Bar.
If you wish to create a new report, use the Filter Bar to create a new report.
1
Click the Reports tab.
2
3
Click on User Activity > Details to bring up the User Activity Analyzer. The User Activity Analyzer generates a Detail report based on the user name.
 
If no user activity reports were saved, only the Filter Bar displays, with the User filter pre-selected. You can enter a specific user name, or use the LIKE operator wildcards (*) to match multiple names.
4
The customized User Activity Details report displays a timeline of events, Initiators, Responders, Services, Applications, Sites visited, Blocked site access attempted, VPN access policy in use, user authentication, Intrusions, Initiator Countries, and Responder Countries associated with that particular user.
Data for a particular user might not be available for all of these categories.
Viewing Applications Reports
Application Reports provide details on the applications detected and blocked by the firewall, and their associated threat levels.
1
Click the Reports tab.
2
3
Click Applications > Data Usage.
The Applications Report displays a pie chart with the application and threat level it poses.
 
You can drill down for additional Details views on connections over time (Timeline view), Data Usage, Detected applications, Blocked applications, Categories of applications, top initiators.
Viewing Web Activity Reports
Web Activity Reports provide detailed reports on browsing history.
1
Click the Reports tab.
2
3
Click Web Activity > Categories.
The Web Activity Report displays a pie chart with the Top Categories of type of access, total browse time, and hits.
You can drill down for additional Details views on connections over time (Timeline view), Sites visited, Categories of sites, and Top Initiators. A Details entry links directly to the details view of all entries.
Viewing Web Filter Reports
Web Filter Reports provide detailed reports on attempts to access blocked sites and content.
1
Click the Reports tab.
2
3
Click Web Filter > Categories.
The Web Filter Report displays a pie chart with the Top Categories of blocked access and total attempts to access.
 
You can drill down for additional Details views on connections over time (Timeline view), Sites visited, Categories of sites, and Top initiators. A Details entry links directly to the details view of all entries.
Viewing VPN Usage Reports
VPN usage reports provide details on the services and policies used by users of virtual private networks.
1
Click the Reports tab.
2
3
Click VPN Usage > Policies.
The VPN Usage Report displays total connections for each VPN Policy item as a pie chart and tabular grid view.
 
You can drill down for additional Details views on Service protocols and Top initiators.
Viewing Intrusions Reports
Intrusion Reports, based purely on IPS signatures, provide details on types of intrusions and blocked access attempts.
1
Click the Reports tab.
2
3
Click Intrusions > Detected.
The Attacks report provides a pie chart and a list of the initiating IP addresses, hosts, and users, with number of attempts for each.
 
Drill down for additional Detail views of Intrusion Categories, Targets, Initiators, Ports affected, Target Countries, and Initiator Countries.
Viewing Botnet Reports
Botnet reports provide details on the botnet attempts that were blocked when attempting to access the firewall.
1
Click the Reports tab.
2
3
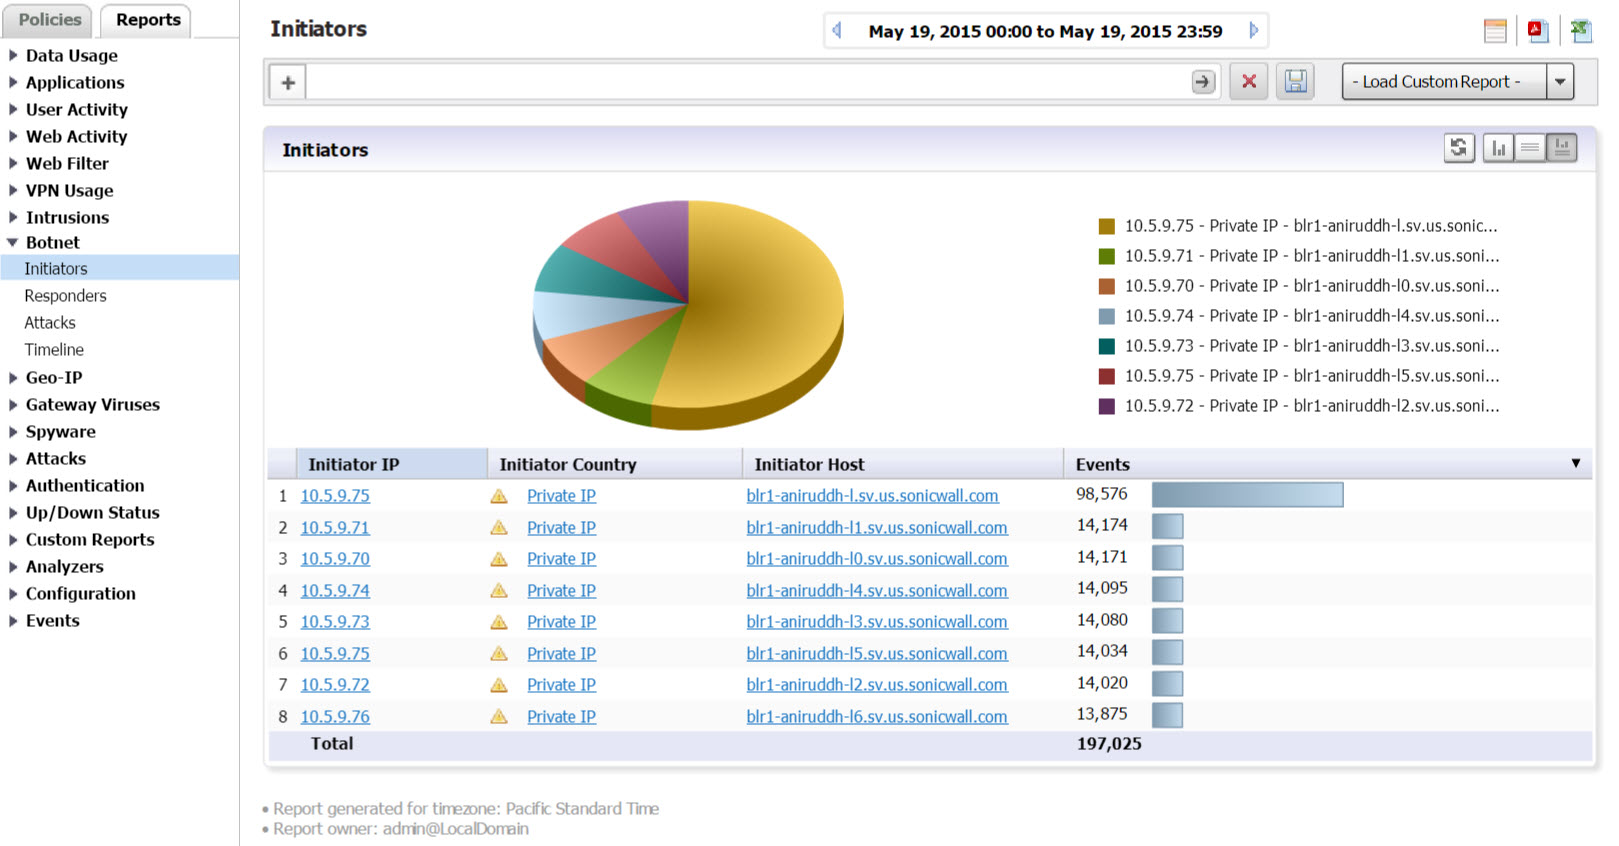
Click Botnet > Initiators.
The top botnet attacks report appears. The Initiators report provides a pie chart and a list of the initiating IP addresses, countries, hosts, and events, with number of attempts for each.
Drill down for additional detailed views of Attacks, Targets, Initiators, Ports affected, Initiator Countries, and Target Countries.
Viewing Geo-IP Reports
Geo-IP reports provide details on the botnet attempts that were blocked when attempting to access the firewall.
1
Click the Reports tab.
2
3
Click Geo-IP > Initiator Countries.
The top Geo-IP initiator report appears. The Initiators report provides a pie chart of threat initiator countries blocked and events, with number of attempts for each.
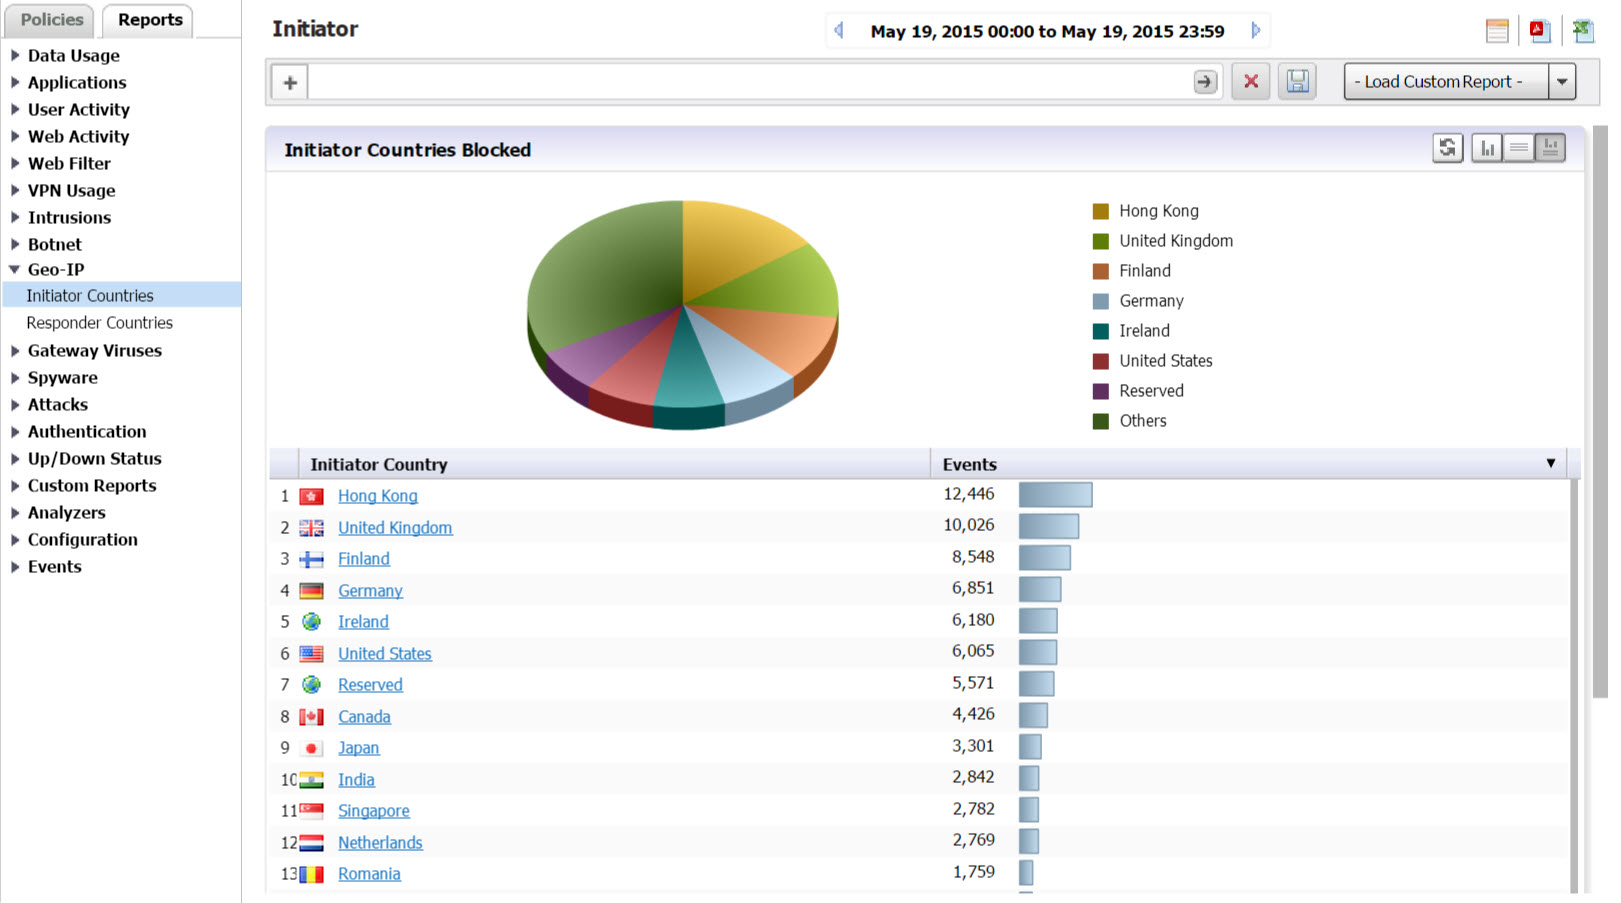
Drill down for additional detailed views of Initiator IPs, Hosts, Initiator MACs, Users, and Events.
Viewing Gateway Viruses Reports
The Gateway Viruses reports provide details on the Top Viruses that were blocked when attempting to access the firewall.
1
Click the Reports tab.
2
3
Click Gateway Viruses > Blocked.
The Top Viruses report appears.
The report provides details on the viruses blocked, the targets, initiators, and a timeline of when they attempted access.
 
Drilling down provides a list of virus identity, Targets, Initiators, Target Countries, and Initiator Countries.
Viewing Spyware Reports
The Spyware report gives details of the spyware that was detected and/or blocked, the targets, initiators, and a timeline of when they attempted access.
1
Click the Reports tab.
2
3
Click Spyware > Detected.
The report provides details on the types of spyware detected and blocked, targets.
Drilling down provides a list of virus identity, Targets, Initiators, Target Countries, and Initiator Countries. Drilling down lists countries of origin, and target countries.
Viewing Attacks Report
Attack reports are legacy reports that are not signature-based or not deep-packet-inspection-based. Instead, they are based on stateful packet inspections. For instance, port-scan, IP Spoof, and so on.
The Attacks report lists attempts to gain access, target systems, initiators, and a timeline of when the attack occurred.
1
Click the Reports tab.
2
3
Click Attacks > Attempts.
The Attacks report provides a pie chart and a list of the initiating IP addresses and hosts.
 
Drill down for additional Detail views of Intrusion Categories, Targets, Initiators, Ports affected, Target Countries, and Initiator Countries.
Viewing Authentication Reports
Authentication reports provide information on users attempting to access the Firewall.
1
Click the Reports tab.
2
3
Click Authentication > User Login.
The Authentication report displays a list of authenticated users, their IP addresses, service, time they were logged in, and type of login/logout. Additional Reports are available for Administrator logins and failed login attempts.
 
Clicking hyperlinks provides additional filtering for the reports.
You can filter on the Service to view SMA and other appliances by drilling down to the syslog.
1
Go to the filter bar and click on the + and select Service from the pull-down menu. Click the = operator, and click on the field next to it to bring up the pull-down menu. Select SSLVPN from the pull-down list
 
2
Click Go to view a report for that Service.
Viewing Flow Activity Reports
The Flow Activity Reports offers administrators an effective and efficient interface to visually monitor their network in real time, providing effective flow charts of real-time data, customizable rules, and flexible interface settings. With the Flow Activity Reports, administrators can efficiently view and sort real-time network and bandwidth data in order to:
The GMS management interface includes the following for Flow Activity:
Real-Time Viewer
The Real-Time Viewer provides administrators an inclusive, multi-functional display with information about applications, bandwidth usage, packet rate, packet size, connection rate, connection count, and multi-core monitoring.
Using the Toolbar
The Real-Time Viewer Toolbar contains features to specify the refresh rate, export details, configure color palettes, change the amount of data displayed, and pause or play the data flow. Changes made to the toolbar apply across all the data flows.
Select Default for a default range of colors.
Select Generate to generate a random range of colors.
If a gradient is desired, select the Use Gradient box located below the text fields.
The Pause button appears gray if the data flow has been frozen.
Applications Monitor
The Applications data flow provides a visual representation of the current applications accessing the network.
Options are available to Display, Scale, and View the Application interface.
 
Available Formats
Administrators are able to view the Application flow charts in a bar graph format or flow chart format. The bar graph format displays applications individually, allowing administrators to compare applications. In this graph, the x-axis displays the name of the applications. The y-axis displays the amount of traffic for each application. The following example is a “Flow Chart” view.
The flow chart format displays stacked application data. In this graph, the x-axis displays the current time and the y-axis displays the traffic for each application. The following example is a “Bar Chart” view.
Ingress and Egress Bandwidth Flow
The Ingress and Egress Bandwidth data flow provides a visual representation of incoming and outgoing bandwidth traffic. The current percentage of total bandwidth used, average flow of bandwidth traffic, and the minimum and maximum amount of traffic that has gone through each interface is available in the display. Administrators are able to view the Ingress and Egress Bandwidth flow chart in a bar graph format or flow chart format.
The bar graph format displays data pertaining to individual interfaces in a bar graph; allowing administrators to compare individual Bandwidth Interfaces. In this graph, the x-axis denotes the Interfaces whereas the y-axis denotes the Ingress and Egress Bandwidth traffic.
The flow chart format overlaps the Bandwidth Interfaces; allowing administrators to view all of the Ingress and Egress Bandwidth traffic as it occurs. The x-axis displays the current time and the y-axis displays the Ingress and Egress Bandwidth traffic.
Options are available to customize the Display, Scale, and View of the Ingress and Egress Bandwidth interface.
 
Tooltips
Rolling over the interfaces provides tooltips with information about the interface assigned zone, IP address, and current port status.
Packet Rate Monitor
The Packet Rate Monitor provides the administrator with information on the ingress and egress packet rate in packet per second (pps). This can be configured to show packet rate by network interface. The graph shows the packet rate current average, minimum packet rate, and maximum packet rate for both ingress and egress network traffic.
Packet Size Monitor
The Packet Size Monitor provides the administrator with information on the ingress and egress packet rate in bytes (B). This can be configured to show packet size by network interface. The graph shows the packet size current average, minimum packet size, and maximum packet size for both ingress and egress network traffic.
Connection Count Monitor
The Connection Count data flow provides the administrator a visual representation of “current” total number of connections, “peak” number of connections, and maximum. In this example, the y-axis displays the total number of connections from 0C (zero connections) to 1KC (one kilo connections).
Multi-Core Monitor Flow
The Multi-Core Monitor displays dynamically updated statistics on utilization of the individual cores of the SonicWALL SuperMassive. Core 1 through core 8 handles the control plane. Core 1 through core 8 usage is displayed in green on the Multi-Core Monitor. The remaining cores handle the data plane. To maximize processor flexibility, functions are not dedicated to specific cores; instead all cores can process all data plane tasks. Memory is shared across all cores. Each core can process a separate flow simultaneously, allowing for up to 88 flows to be processed in parallel.
Administrators are able to view the Multi-Core Monitor flow chart in a bar graph format or flow chart format. The bar graph format displays data pertaining to individual cores. In this graph the x-axis displays the cores where the y-axis displays the percentage of CPU used.
The flow chart format overlaps the Multi-Core Monitor data. The x-axis displays the current time and the y-axis displays the percentage of CPU used.
Scale, and View are options available to customize the Multi-Core Monitor interface.
 
Reports_FlowActivity_TopFlowsDashboard_Snwls
Top Flows Dashboard
The Top Flows Dashboard page displays the top flows for the following:
Top Flows Dashboard Action Items
The Top Flows Dashboard Toolbar allows for customization of the Top Flows interface. The ability to select the duration of time and start/end date for more application and user control.
This table details the action items of the Top Flows Dashboard.
 
Table 53. Action items
Flow Analytics
The Flow Analytics page provides administrators with real-time, incoming and outgoing network data. Various views and customizable options in the Flow Analytics Interface assist in visualizing the traffic data by applications, users, URLs, initiators, responders, threats, VoIP, VPN, devices, or by contents. Filter Options
The Flow Analytics Filter Options allows the administrator to filter out incoming, real-time data. Administrators can apply, create, and delete custom filters to customize the information they wish to view. The Filter Options apply across all the Application Flow tabs. Refer to Using Filtering Options .
 
Table 54. Filter options
Flow Analytics Tabs
The Flow Analytics Tabs contains details about incoming and outgoing network traffic. Each tab provides a faceted view of the network flow. The data is organized by Applications, Users, URLs, Initiators, Responders, Threats, VoIP, VPN, Devices, and Content.
The URLs tab displays a list of URLs currently accessed by Users.
Flow Analytics Toolbar
The AppFlow Toolbar allows for customization of the Flow Analytics interface. The ability to create rules and add items to filters allows for more application and user control. Different views, pause and play abilities, customizable data intervals and refresh rates are also available to aid in visualizing incoming, real-time data.
 
Group Options
The Group option sorts data based on the specified group. Each tab contains different grouping options.
Flow Analytics Views
Three views are available for the Flow Analytics: Detailed List View, Pie Chart and Flow Chart Graph View. Each view provides the administrator a unique display of incoming, real-time data.
List View
In the List View, each tab is comprised of columns displaying real-time data. These columns are organized into sortable categories.
Check Box: Allows the administrator to select the line item for creation of filters.
Main Column: The title of the Main Column is dependent on the selected tab. For example, if the Users Tab is the selected, then the Main Column header reads “Users.” In that column, the name of the Users connected to the network are shown. Clicking on the items in this column brings up a popup with relevant information on the item displayed.
Sessions: Clicking on this number brings up a table of all active sessions.
Packets: Displays the number of data packets transferred.
Bytes: Displays the number of bytes transferred.
Rate (KBps): Displays the rate at which data is transferred.
Threats: Displays the number of threats encountered by the network.
Total: Displays the total Sessions, Packets, and Bytes sent during the duration of the current interval.
Application Details
Each item listed in the Main Column provides a link to an Application Detail dialog. A display appears when the item links are clicked. The dialog provides:
Graph View
The Graph View displays the top applications and the percentage of bandwidth used. The percentage of bandwidth used is determined by taking the total amount of bandwidth used by the top applications, and dividing that total by the amount of top applications.
Using Filtering Options
Using filtering options allow administrators to reduce the amount of data seen in the Flow Analytics. By doing so, administrators can focus on points of interest without distraction from other applications.
To use the Filtering Options, complete the following steps:
1
Navigate to Flow Activity > Flow Analytics > Applications. Select the check boxes of the applications you wish to add to the filter. In this case, Ventrilo is selected.
2
Click Filter View to add Ventrilo to the filter.
3
More information about Users, peer connectivity, and packets sent are visible in the Flow Analytics tabs. The Users using Ventrilo are visible in the Users tab. The IP Addresses of these users are visible in the Initiators tab. The IP Addresses of the connected peers who are sharing packets are visible in the Responders Tab.
Flow Reports
The Flow Reports page provides administrators with configurable scheduled reports by applications, viruses, intrusions, spyware, and IP. Flow Reports statistics enable network administrators to view a top-level aggregate report of what is going on in your network.
Flow Reports Tabs
The Flow Reports Tabs contains details about incoming and outgoing network traffic. Each tab provides a faceted view of the network flow.
The Applications tab displays a list of Applications currently accessing the network.
The Users tab displays a list of Users currently connected to the network.
The IP tab displays a list of the IP addresses currently accessing the network.
The Viruses tab displays a list of detected viruses on the network.
The Intrusions tab displays a list of the attempted intrusions over the selected time period.
The Spyware tab displays a list of detected spyware on the network.
The Location tab displays a list of locations that users are accessing the network from.
The URL Rating tab displays a list of rated URLs on the network.
Flow Reports Toolbar
The Flow Reports Toolbar allows for customization of the Flow Reports interface. The ability to create rules and add items to filters allows for more application and user control. Different views, pause and play abilities, customizable data intervals and refresh rates are also available to aid in visualizing incoming, real-time data.